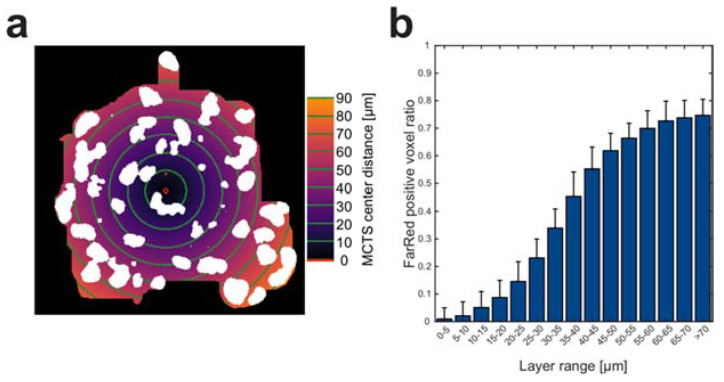
Figure 3.
Cellular arrangement in core-shell spheroids. Each MCTS (n = 20) was divided into 5 µm thick concentric layers (every 10 µm marked by green lines) based on distance (colormap indicates distance away from center) from the MCTS center (red dot) (a). The ratio between Far Red positive voxels against total number of voxels was calculated in all layers (b). Scale bar is 20 µm.

