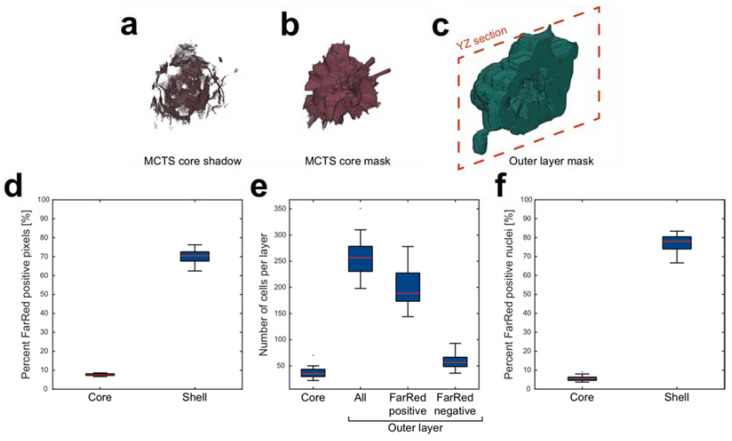
Figure 5.
Edge-line analysis enables core and shell segmentation for content analysis. The outer edge points of the MCTS core (MCTS core shadow) was detected by identifying the first Far Red positive voxel in each edge-center line (a) and used to create a core mask (b). The full MCTS volume subtracted by the core mask was used to define the shell mask (centrally placed void illustrates the border between shell and core in the YZ plane marked by a dashed red line) (c). The ratio between far red positive voxels and the total amount of voxels was calculated (d) and the numbers of cells in the core, shell, far red positive and far red negative parts of the shell were estimated by dividing the total DAPI volume by the median nucleus volume in each compartment (e). The number of cells in each compartment was used to calculate the number of cells that was found in the Far Red positive volume (f). Boxplots show the 25th and 75th percentiles with a red line marking the median value. The whiskers show the furthest observation 1.5 times the interquartile length away from the box edge while outliers are marked with a blue dot.

