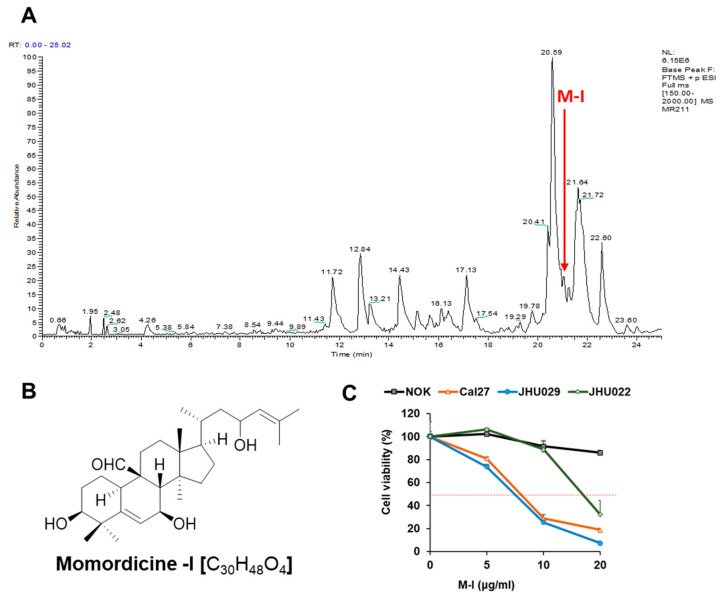
Figure 1.
Mass-spectrometric analysis of bitter melon extract and identification of momordicine-I. (A) LC trace of bitter melon extract done by HRMS. The red arrow indicated the presence of momordicine-I (M-I) peak. (B) Chemical structure of momordicine-I. (C) HNC cells (Cal27, JHU029, JHU022) and control NOK were treated with M-I at different concentration for 48 h, and cytotoxicity assay was performed. Small bar indicates standard error.

