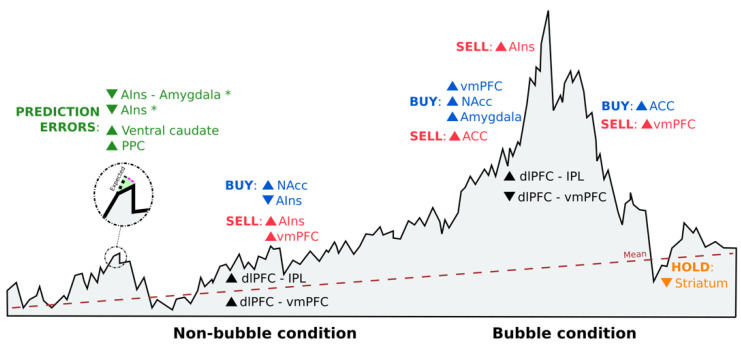
Figure 3.
Schematic representation of brain activation reported in the ALE meta-analysis study during investment decision-making. Sell orders are shown in red, buy orders are in blue, and neither sell nor buy orders (hold) are in orange. Each order is accompanied by increased (▲) or decrease (▼) neural activity in certain brain areas. Prediction errors appear in green, where (*) indicates that reappraisal strategies were implemented. The location of each activation in the figure is based on the situation of the market, being under bubble or non-bubble conditions. Black indicates brain connectivity activation under both market conditions. AIns = anterior insula; PPC = posterior parietal cortex; NAcc = nucleus accumbens; vmPFC = ventromedial prefrontal cortex; ACC = anterior cingulate cortex; dlPFC = dorsolateral prefrontal cortex; and IPL = inferior parietal lobule.

