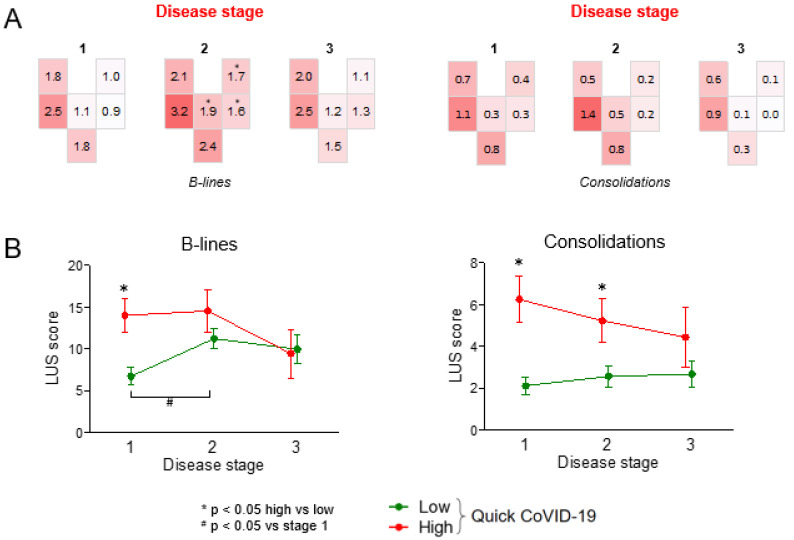
Figure 2.
LUS patterns according to disease stage. (A) Geographical LUS patterns according to disease stage (1: day 0–6; 2: day 7–13; 3: day 14+). * p < 0.05 versus stage 1. (B) Time trend of the total B-line and consolidation score in the two groups of patients divided according to the quick COVID-19 severity index (* p < 0.05 high vs. low; # p < 0.05 vs. stage 1).

