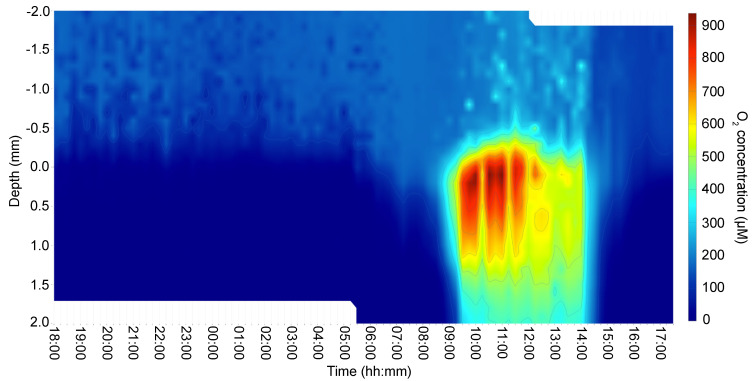
Figure 2.
A heat map of the vertical O2 concentration profiles in the cyanobacteria-dominated microbial mat of Nakabusa Hot Springs as measured over a diel cycle. The O2 concentration (µmol L−1) was measured as a function of depth in the microbial mat at 15-min intervals for 24 h from 18:00 on 3 November to 18:00 on 4 November. The mat surface is indicated by 0 mm. Positive depth values indicate the depth below the mat surface, and negative values indicate the depth above the mat surface, i.e., the distance into the overlying water column of the hot spring.

