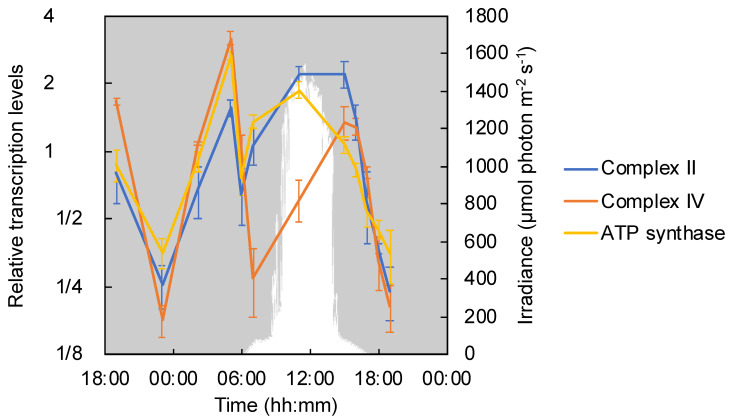
Figure 5.
Relative transcription levels of respiratory complex II, IV and ATP synthase. The mean values of the relative transcripts of respiratory complex II (Cagg_1576–1578, blue line), complex IV (Cagg_1519–1522, orange line) and ATP synthase (Cagg_0984—991, yellow line) are shown with standard deviations. The downwelling photon irradiance (PAR; 400–700 nm) is indicated in white.

