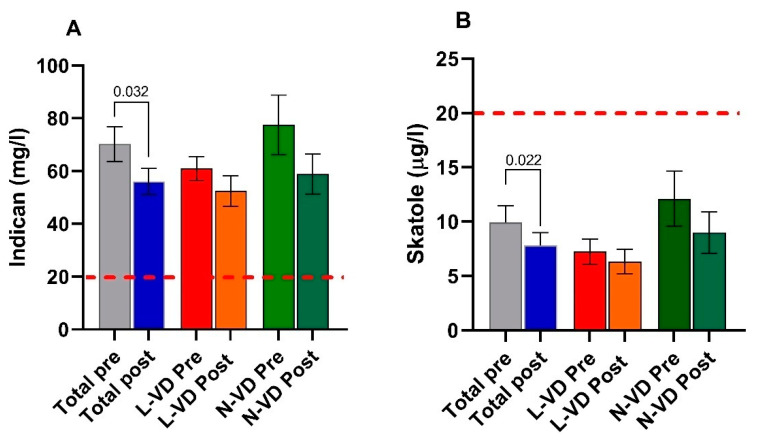
Figure 5.
Indican (panel (A)) and skatole (panel (B)) levels as markers of dysbiosis before (pre) and after (post) 12 weeks of low FODMAP diet in the whole group of IBS-D patients and categorized in L-VD and N-VD subgroups according to their low or normal VD levels at baseline. Data expressed as means ± SEM. Wilcoxon rank-sum-test was used to compare pre- and post-treatment data. The Mann–Whitney test was applied in comparing the two subgroups before and at the end of the diet. Differences considered significant at p < 0.05. Red dotted lines indicate the cutoff value.

