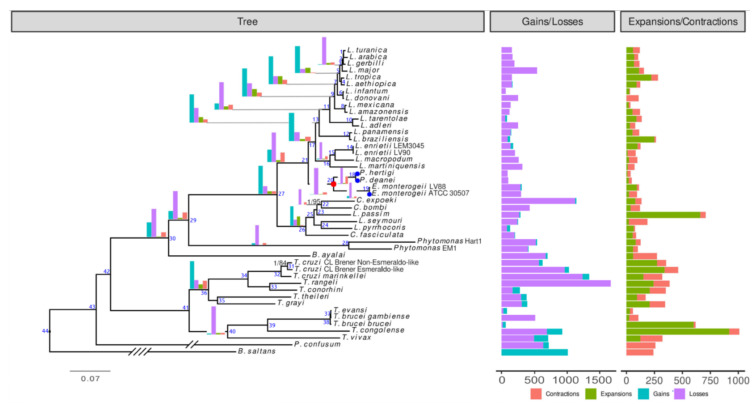
Figure 1.
Phylogenomic tree based on 410 proteins encoded by single-copy genes from 44 trypanosomatids and the eubodonid Bodo saltans, Posterior probabilities and bootstrap supports are shown (in black) only if the latter is <100%. The scale bar represents substitutions per site. The numbers of orthologous groups (OG) gained/lost/expanded/contracted at certain nodes and leaves (species) are depicted using bar plots placed at the nodes and on the right of the tree, respectively (see Table S8 for exact counts; node numbers indicated in blue correspond to those in the Table S8). The Endotrypanum/Porcisia node (node 20) and the isolates sequenced in this study are marked with red and blue circles, respectively. The length of B. saltans and P. confusum branches was reduced four- and two-fold, respectively, for visualization purposes.

