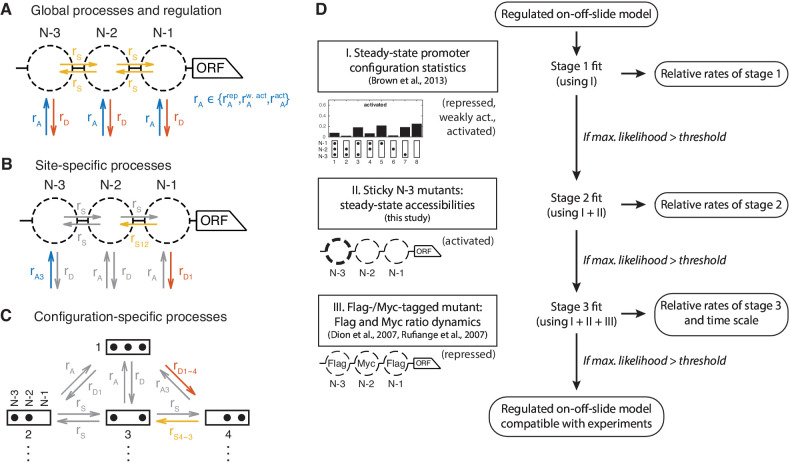
Figure 2. Definition and evaluation workflow of regulated on-off-slide models.
On-off-slide models consist of processes from different hierarchies: (A) Global processes for assembly, disassembly and (optional) sliding. Global processes govern all reactions of the corresponding type with the same rate , or . To fit multiple promoter states simultaneously, some processes have to be regulated, that is, have different rate values depending on the promoter state. In this example, the global assembly process is regulated. (B) Optional site-specific processes for assembly and disassembly at each position (example here with rates and ) and for sliding between each neighboring pair of positions (here ). Reactions in gray have not been overruled by more specific processes (here: site-specific processes) and consequently are still determined by the rate parameters of processes on the less specific hierarchy level (here: global processes). (C) The last hierarchy level is given by optional configuration-specific processes governing only one reaction (here with rates and ). Here, only the promoter configurations 1 to 4 are shown. (D) Each regulated on-off-slide model is fitted and evaluated successively using the experimental data on the left-hand side (promoter states during the experiment given in parentheses). Models are discarded if they do not match the maximum likelihood threshold after each stage. With each additional experimental data set, the fit results in new optimal relative rate values of the model. Only the dynamic Flag-/Myc-tagged histone measurements enable us to also fit the time scale.
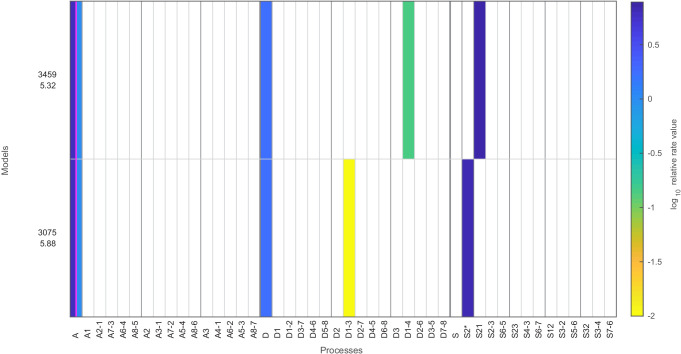
Figure 2—figure supplement 1. Occurrences of the different processes in the models with satisfactory likelihood at the different stages.
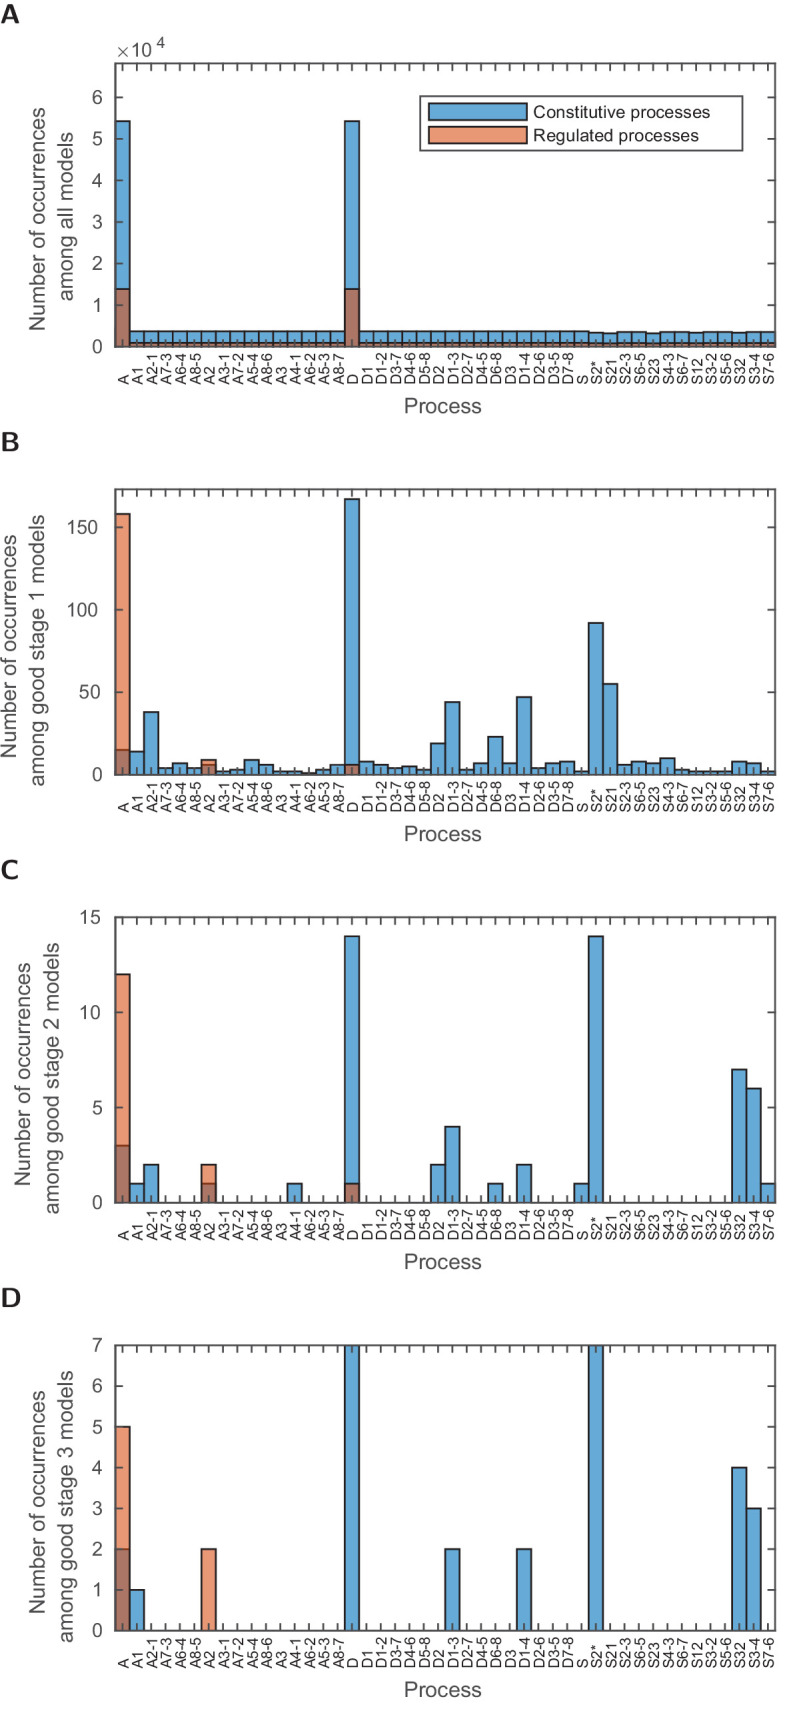
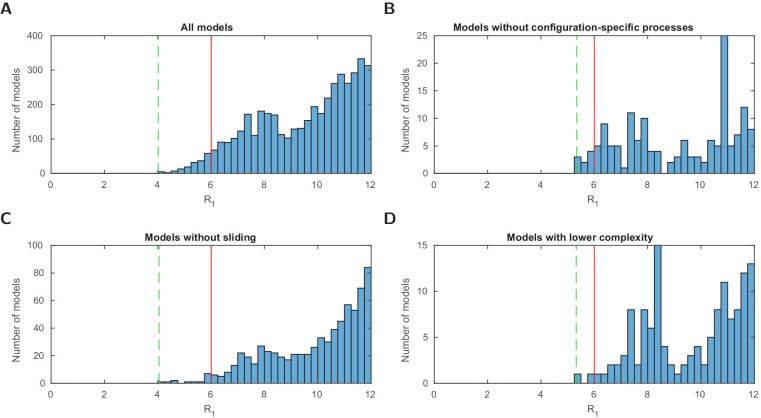
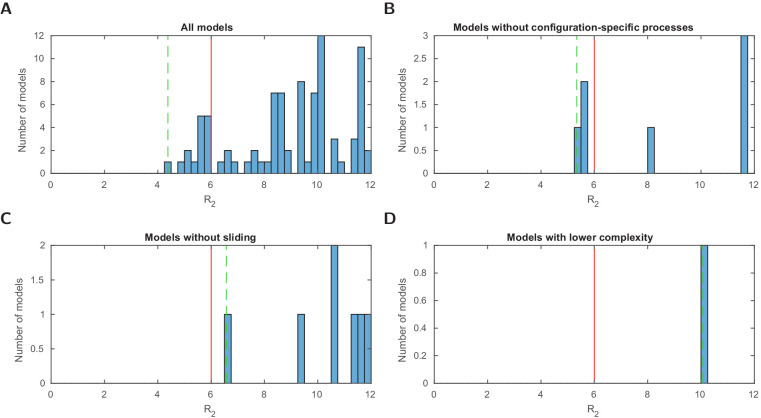
Figure 2—figure supplement 2. Stage 1: logarithmic likelihood ratio histograms.
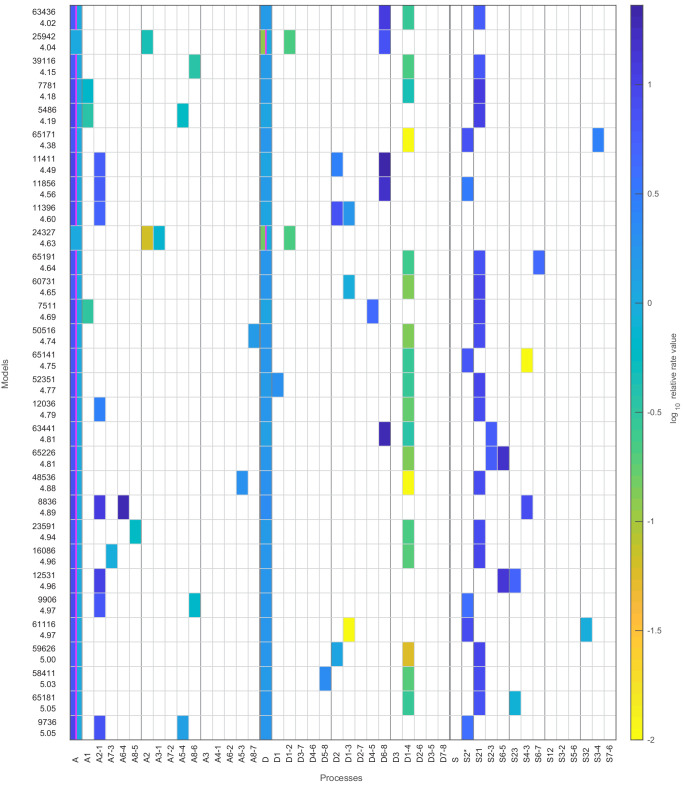
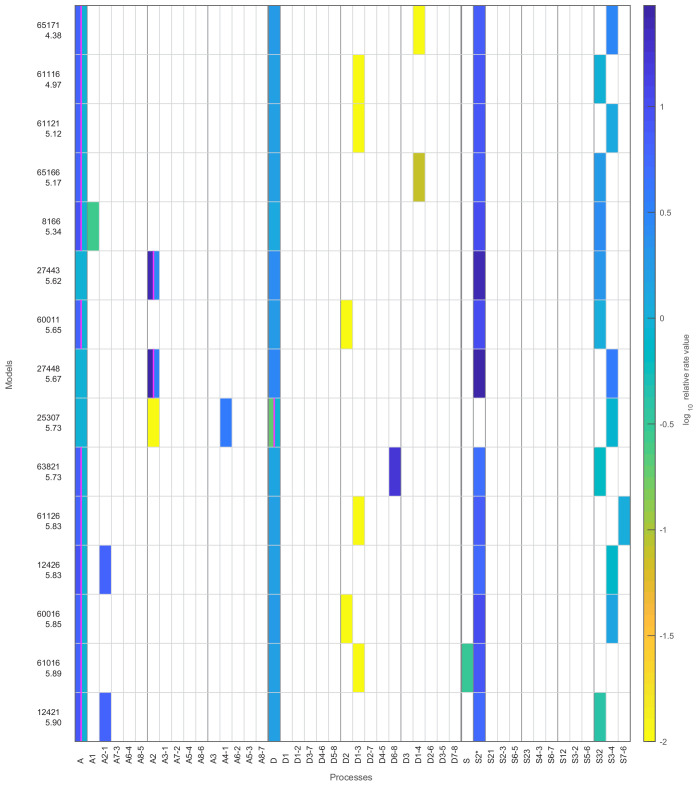
Figure 2—figure supplement 3. Stage 1: top 30 models with likelihood above the threshold.
Figure 2—figure supplement 4. Stage 1: models with likelihood above the threshold and only six fitted parameters.
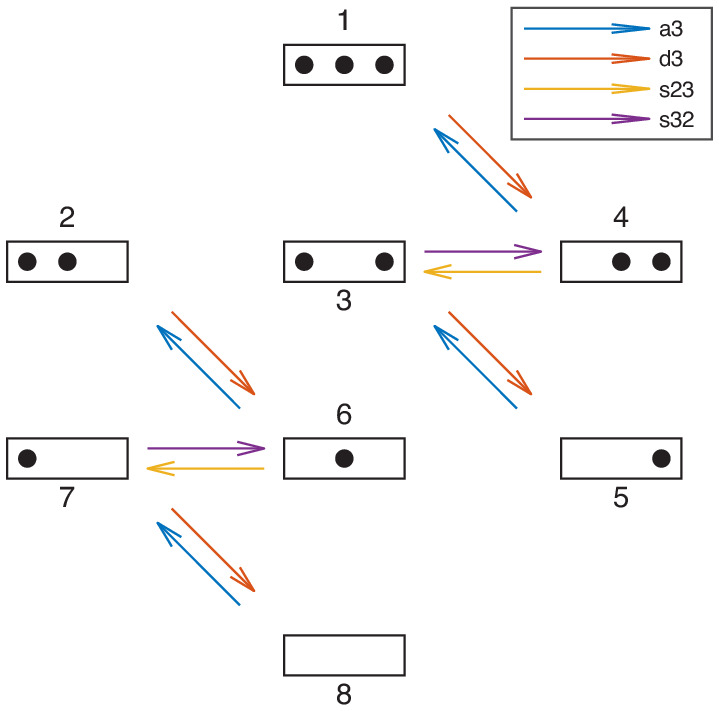
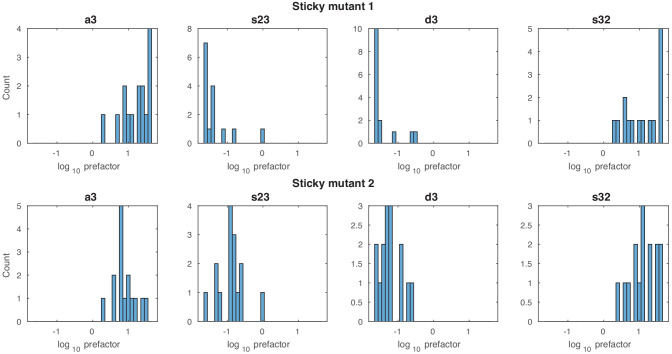
Figure 2—figure supplement 5. Reactions involving the sticky N-3 position.
