. 2021 Mar 5;10:e58394. doi: 10.7554/eLife.58394

Figure 4. The seven models that agree with all four data sets after stage 3.

The colored boxes in each row show the model processes and their rate values. White boxes denote the absence of a process in a model. Regulated processes are separated into two differently colored boxes for repressed (left half) and activated (right half) promoter state. Weakly activated rate values are not shown here. On the left side are the model number and the log10 ratio of the best possible likelihood and the model likelihood, R3. The models are grouped with respect to similarities in the site-centric net fluxes (Figure 5—figure supplement 5). The groups’ representatives are printed in bold with net fluxes compared in Figure 5.

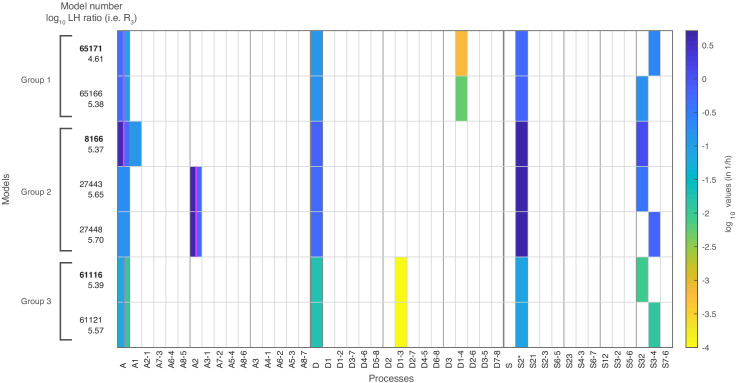
Figure 4—source data 1. Fitted parameter values of constitutive processes and time scale with error estimates.
Figure 4—source data 2. Fitted parameter values of regulated processes with error estimates.

Figure 4.

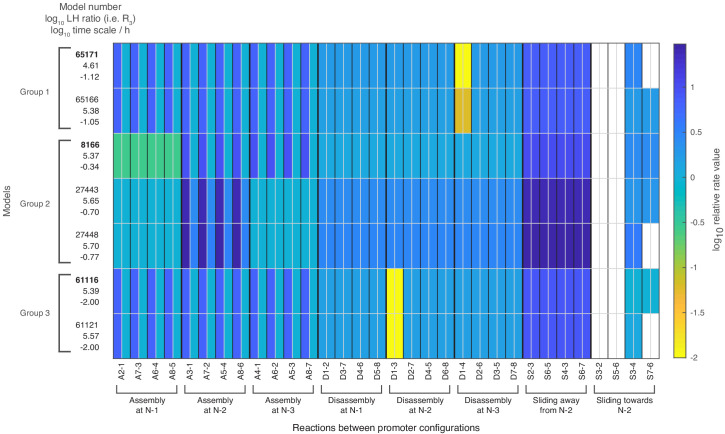
Figure 4—figure supplement 1. Relative rate values for all 32 reactions of the seven satisfactory models.

Figure 4—figure supplement 1.

Rate values for each of the 32 reactions when using the processes and their rate values of each model as shown in Figure 4. The colored boxes show the relative rate values with respect to the global assembly process rate in activated state. White fields correspond to a reaction rate of zero. For a given reaction, the left half shows the repressed value, the right half the activated value. Weakly activated rate values are not shown. The left column shows for each model: the model number, the log10 likelihood ratio R3 and the log10 time scale parameter value.