. 2021 Mar 5;10:e58394. doi: 10.7554/eLife.58394

Figure 5. Overview of net fluxes and site-centric net fluxes for the three group representatives.

First two rows: net fluxes in repressed and activated promoter state (arrows) with configuration probabilities as orange horizontal bars (a filled promoter rectangle corresponds to probability 1). Arrow length indicates the relative flux amount within a flux network with the maximum stated above. Third row: site-centric net fluxes in repressed (red) and activated (green) state, obtained by summing all assembly/disassembly net fluxes at each site and sliding net fluxes between N-1 and N-2 as well as N-2 and N-3. Here, the arrow thickness indicates the amount of flux with the maximum stated above.

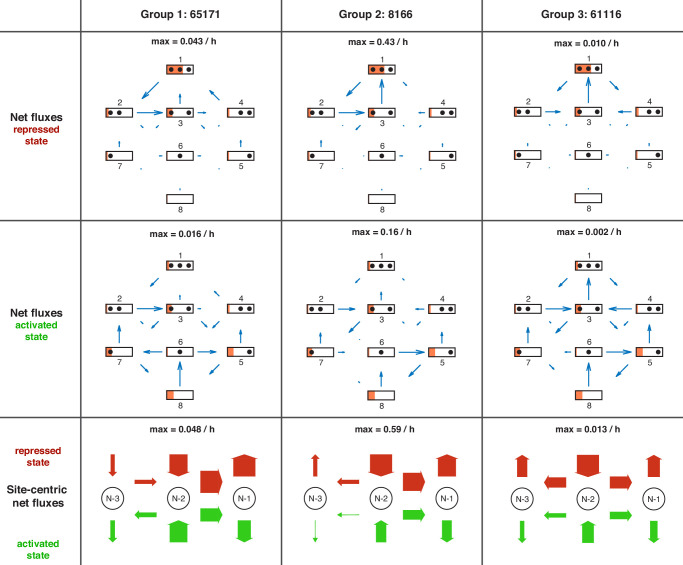
Figure 5.

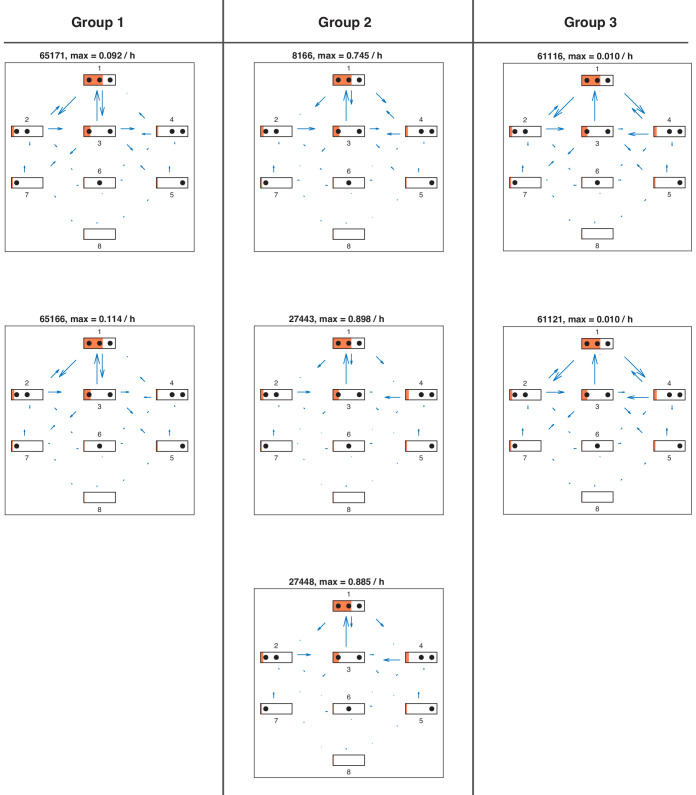
Figure 5—figure supplement 1. Directional fluxes in repressed promoter state of all satisfactory models.

Figure 5—figure supplement 1.

Directional fluxes in repressed promoter state for each satisfactory model in stage 3. The length of the flux arrows indicates the amount of net flux with respect to the maximum value for each model stated above. The orange filling of each state symbol shows the steady state probabilities. The models are grouped with respect to similarities in the site-centric net fluxes (Figure 5—figure supplement 5).
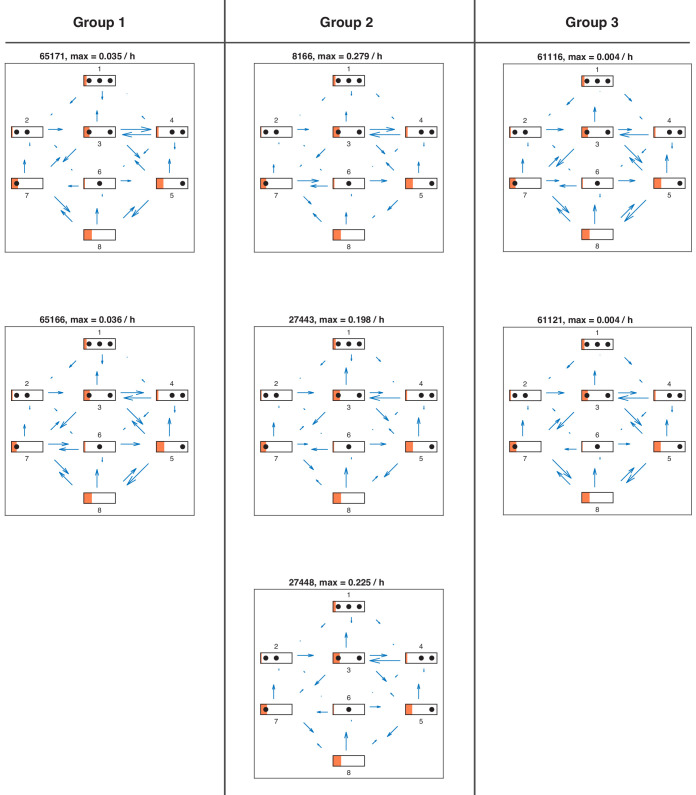
Figure 5—figure supplement 2. Directional fluxes in activated promoter state of all satisfactory models.

Figure 5—figure supplement 2.

Directional fluxes in activated promoter state for each satisfactory model in stage 3.
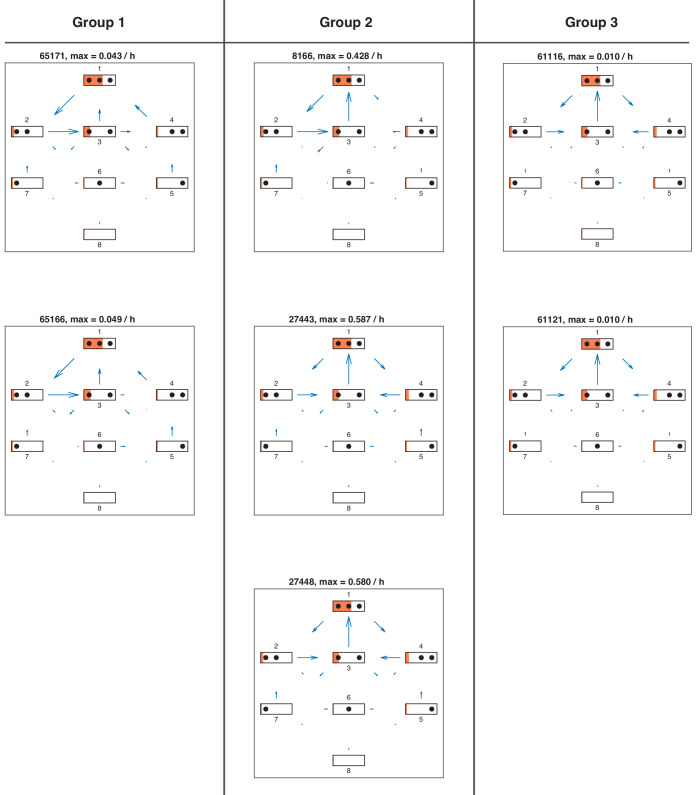
Figure 5—figure supplement 3. Net fluxes in repressed promoter state of all satisfactory models.

Figure 5—figure supplement 3.

Net fluxes in repressed promoter state for each satisfactory model in stage 3. The length of the flux arrows indicates the amount of net flux with respect to the maximum value for each model stated above. The orange filling of each state symbol shows the steady state probabilities. The models are grouped with respect to similarities in the site-centric net fluxes (Figure 5—figure supplement 5).
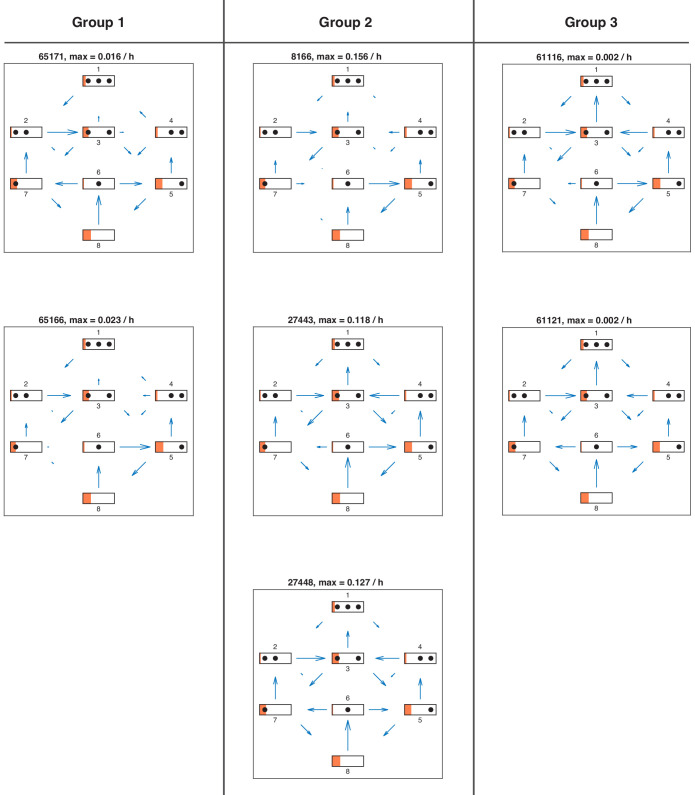
Figure 5—figure supplement 4. Net fluxes in activated promoter state for each satisfactory model in stage 3.

Figure 5—figure supplement 4.

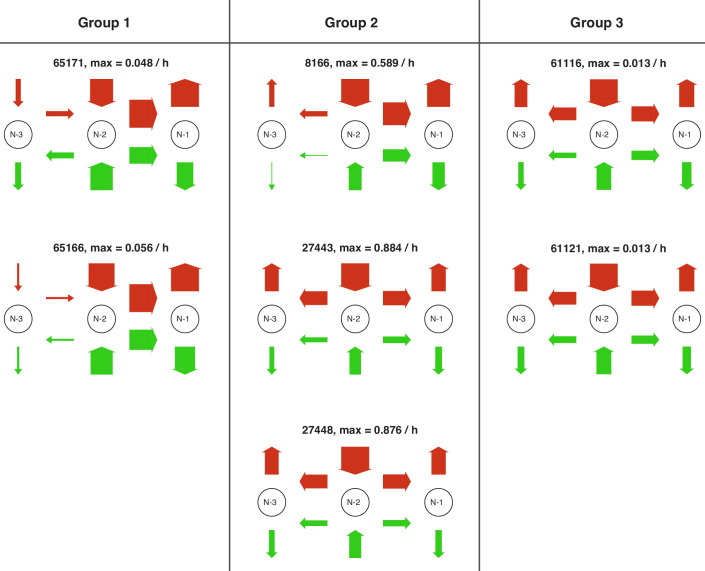
Figure 5—figure supplement 5. Site-centric net fluxes of all satisfactory models.

Figure 5—figure supplement 5.

Site-centric net fluxes in active (green) and repressed (red) promoter state for each satisfactory model in stage 3. Obtained by summing all assembly/disassembly net fluxes at each site and sliding net fluxes between N-1 and N-2 as well as N-2 and N-3. The arrow thickness indicates the amount of flux with the maximum value stated above. The models are grouped with respect to similarities in the site-centric net fluxes (also see main text).
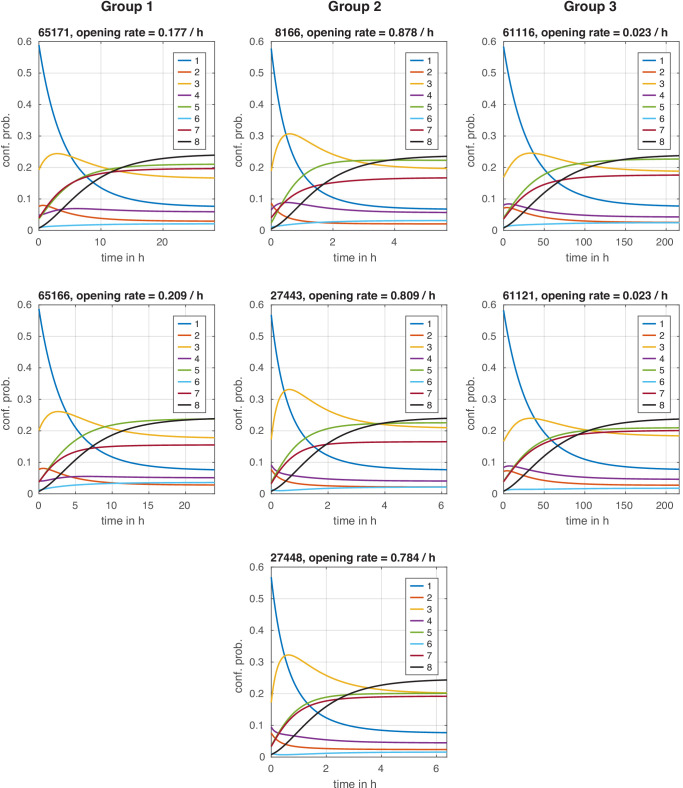
Figure 5—figure supplement 6. Configuration distribution dynamics during chromatin opening with instantaneous signal.

Figure 5—figure supplement 6.

Configuration distribution dynamics during chromatin opening with instantaneous signal. For each model, the distribution starts in the repressed steady state and is then evolved with the transition rate matrix of the activated state, simulating an instantaneous regulation. The effective chromatin opening rate is the slowest negative eigenvalue of this transition rate matrix (see Materials and methods).
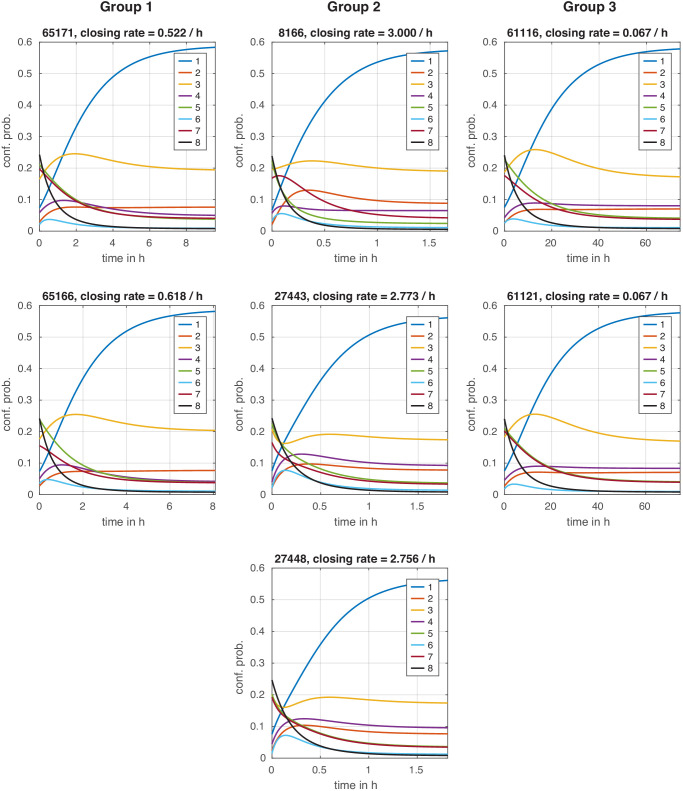
Figure 5—figure supplement 7. Configuration distribution dynamics during chromatin closing with instantaneous signal.

Figure 5—figure supplement 7.

Configuration distribution dynamics during chromatin closing with instantaneous signal. For each model, the distribution starts in the activated steady state and is then evolved with the transition rate matrix of the repressed state, simulating an instantaneous regulation. The effective chromatin closing rate is the slowest negative eigenvalue of this transition rate matrix (see Materials and methods).