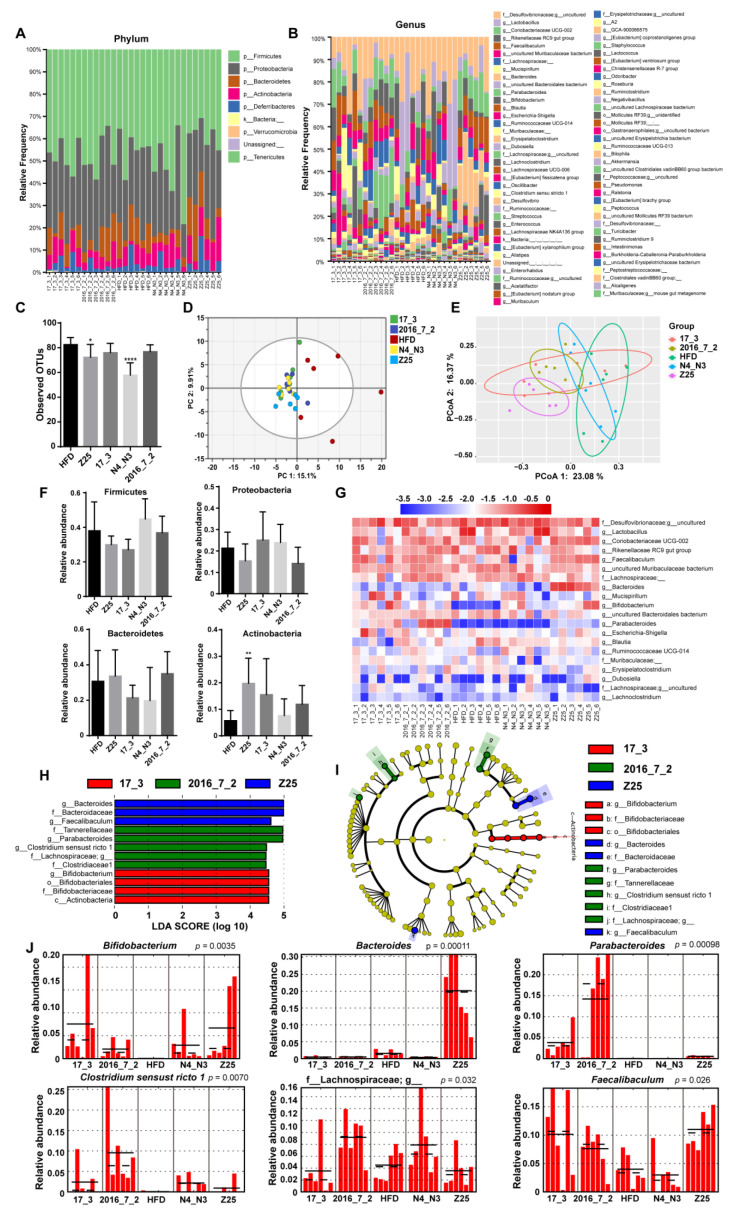
Figure 5.
Effects of B. adolescentis supplementations on colonic gut microbiota. (A,B) Microbiota composition by phylum and genus. (C) Alpha diversity index observed OTUs, (D) PCA score scatter plots for colonic gut microbiota (PC 1 = 15.10%, PC 2 = 9.91%). (E) PCoA of colonic gut microbiota (PCoA 1 = 23.08%, PCoA 2 = 16.37%). (F) The relative abundance of colonic gut microbiota by phylum. (G) Heatmap of the proportion of the top 20 OTUs determined as dominant bacteria. (H) LDA scores of colonic gut microbiota. (I) Cladograms representing the LEfSe results. (J) The abundance histograms of biomarkers detected by LEfSe. Mean values ± SDs are plotted. Asterisks indicate significant differences (Kruskal–Wallis pairwise test for (C): * p < 0.05, **** p < 0.0001; one-way ANOVA for (F): ** p < 0.01; n = 6 mice per group).

