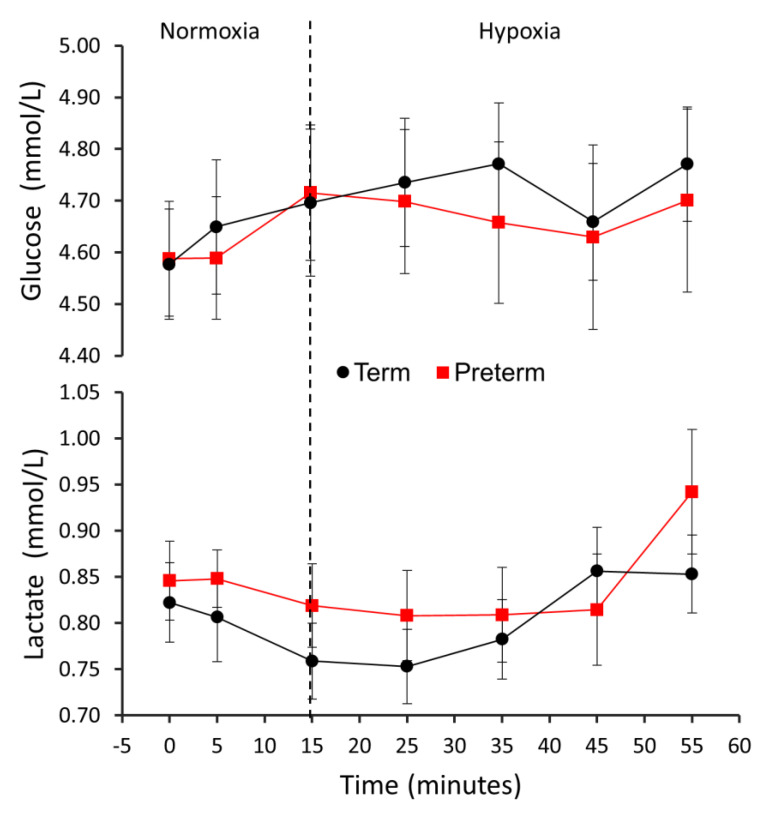
Figure 4.
Serum glucose and lactate levels over the course of the PET experiment. The vertical dotted line represents the time when the oxygen level delivered to the subjects’ breathing masks was lowered from 21% to 12%. Pbirth status indicates the statistical significance of the effect of term vs. preterm group on glucose metabolic rate. Pgas indicates the statistical significance of the effect of normoxic vs. hypoxic air on glucose metabolic rate. Pinteraction indicates the statistical significance of the interaction of term vs. preterm group and normoxic vs. hypoxic air on glucose metabolic rate.

