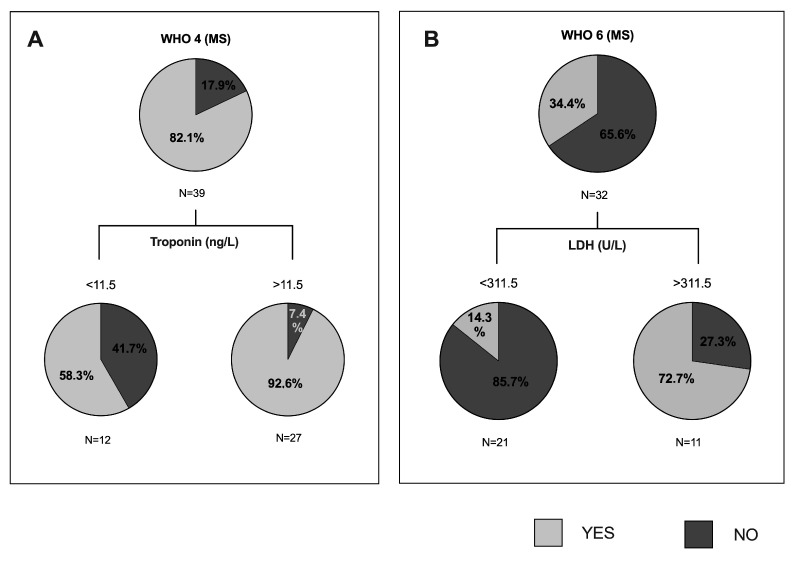
Figure 3.
Classification and regression trees of the cohort with metabolic syndrome were elaborated through CRT method for WHO 4 and WHO 6 variables of severe pneumonia by COVID-19, namely: (4) oxygen by mask or nasal; (6) intubation with mechanical ventilation (MV), mask with reservoir. (A) Pie charts represent the proportion of patients with MS who met the WHO 4 (light grey) or not (dark grey) at each node of the tree. MS: metabolic syndrome. (B) Pie charts represent the proportion of patients who met the WHO 6. MS: metabolic syndrome; LDH: lactate dehydrogenase.

