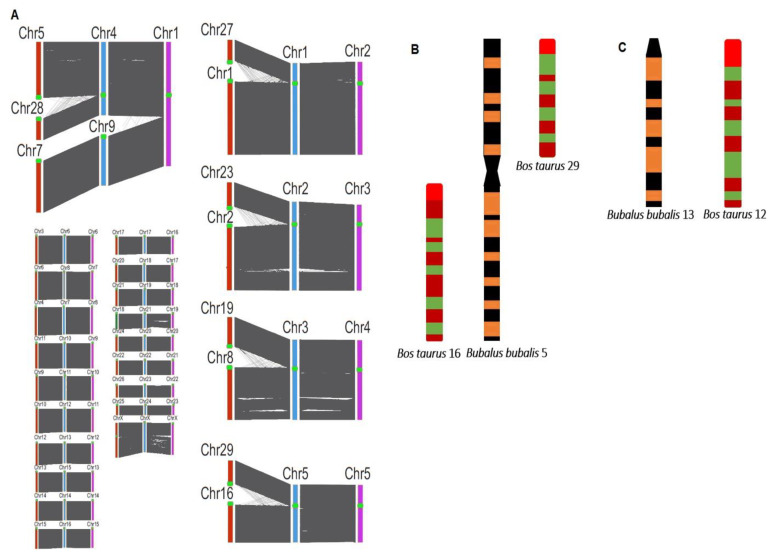
Figure 2.
Cytogenetics of buffaloes (river and swamp) and cattle (Bos taurus). (A) Synteny analysis of buffaloes (river and swamp) and cattle. The cattle chromosomes are presented in red, river buffalo chromosomes in blue, and swamp buffalo chromosomes in pink and centromeres in red dots [21]. (B,C) The similar banding pattern of different chromosomes of buffaloes and cattle [20].

