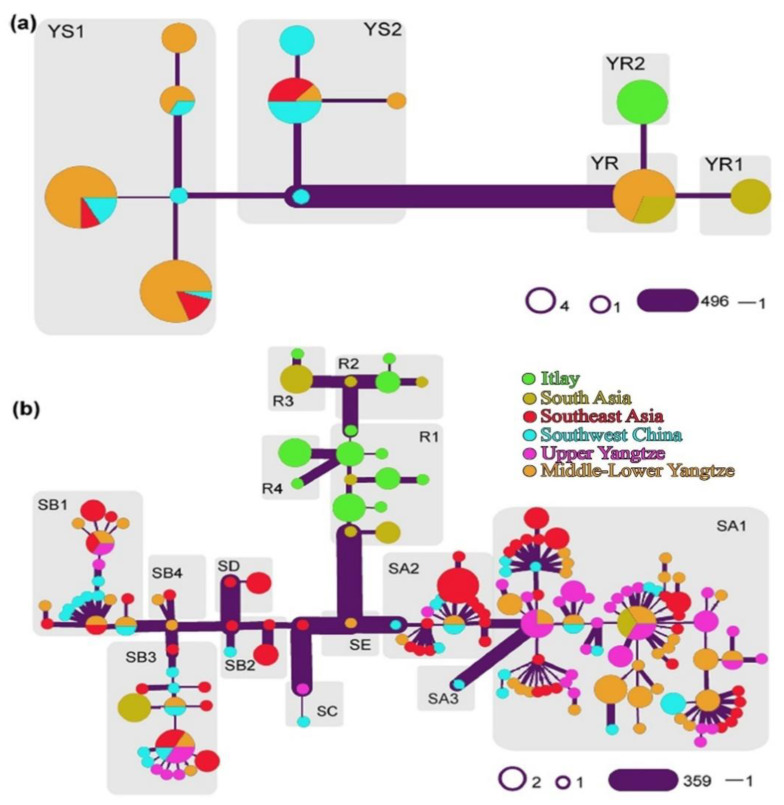
Figure 4.
Phylogenies based on mitogenome and Y-chromosome. The pairwise differences between the adjoining haplotypes are represented by the widths of the edges. (a) The network of Y-chromosome using 520 SNPs. (b) Swamp buffalo mitogenome network. Diverse haplogroups of mitogenomes and Y-chromosomes are characterized in each gray box [47] (figure reproduced by Rehman et al., 2021, with the permission of authors).

