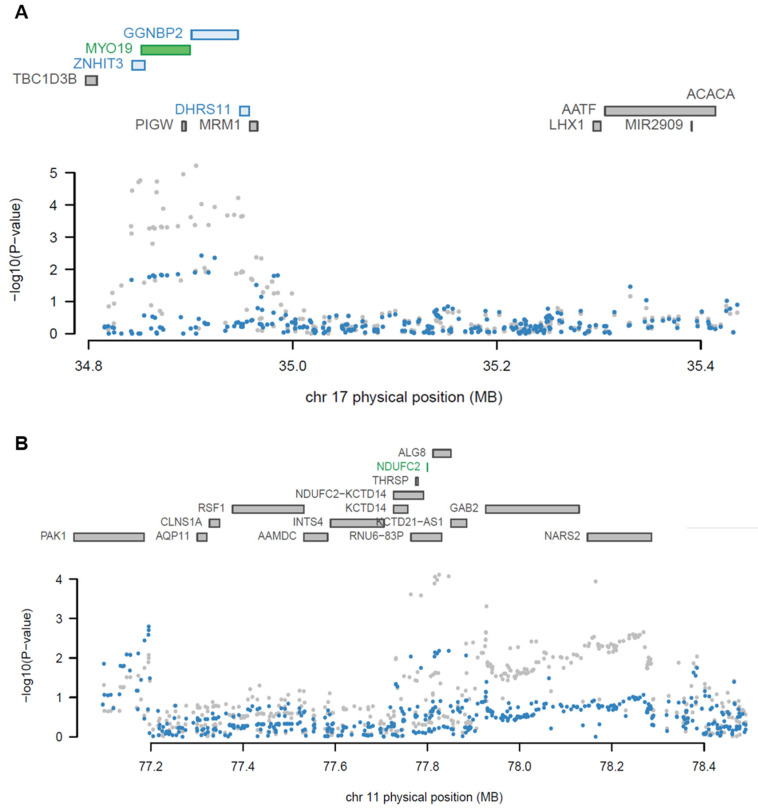
Figure 4.
Regional association plots showing the jointly significant TWAS genes. (A) A regional association plot at chromosome 17 from blood tissue of YFS. (B) A regional association plot at chromosome 11 from the brain cortex of GTEx. Color bars on the top panel show all of the protein-coding genes and/or TWAS genes. Jointly significant genes are highlighted using green bars while marginally significant genes are highlighted using blue bars. A scatter plot at the bottom shows a Manhattan plot of the GWAS data before (gray) and after (blue) conditioning on the independently significant genes.

