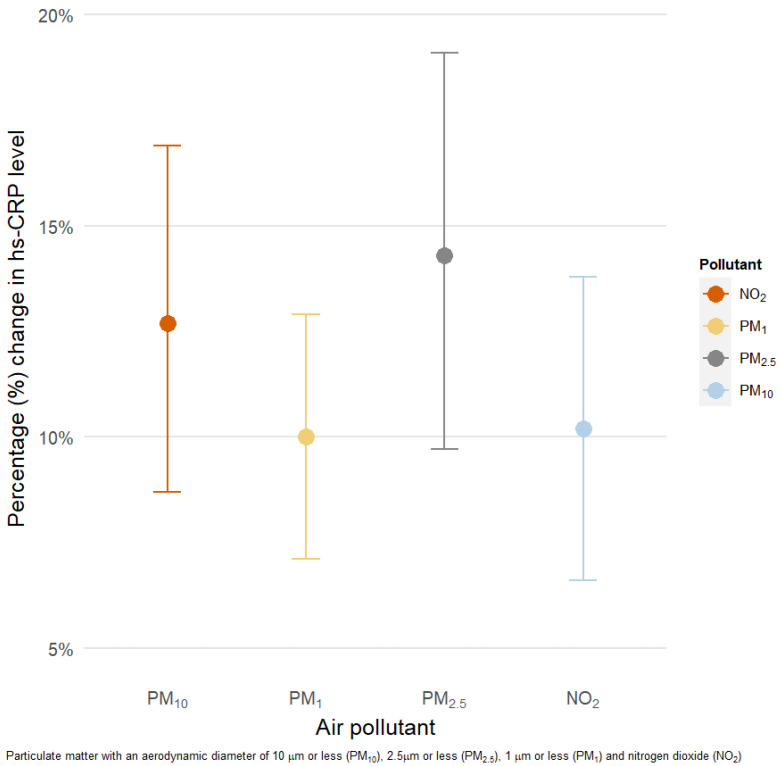
Figure 2.
Percentage change (95% confidence interval (CI)) in high-sensitivity C reactive protein (hs-CRP) levels associated with 10 μg/m3 increase in 3 year moving averages of air pollution. PM10 = particulate matter with a diameter of 10 μm or less, PM2.5 = with a diameter of 2.5 μm or less, PM1 = particulate matter with a diameter of 1 μm or less, NO2 = nitrogen dioxide. Models were adjusted for age, sex, BMI, tobacco use, physical activity, education level, fruit and vegetable intake, alcohol use, type of fuel used at home, median household income, and location of residence (urban/rural).

