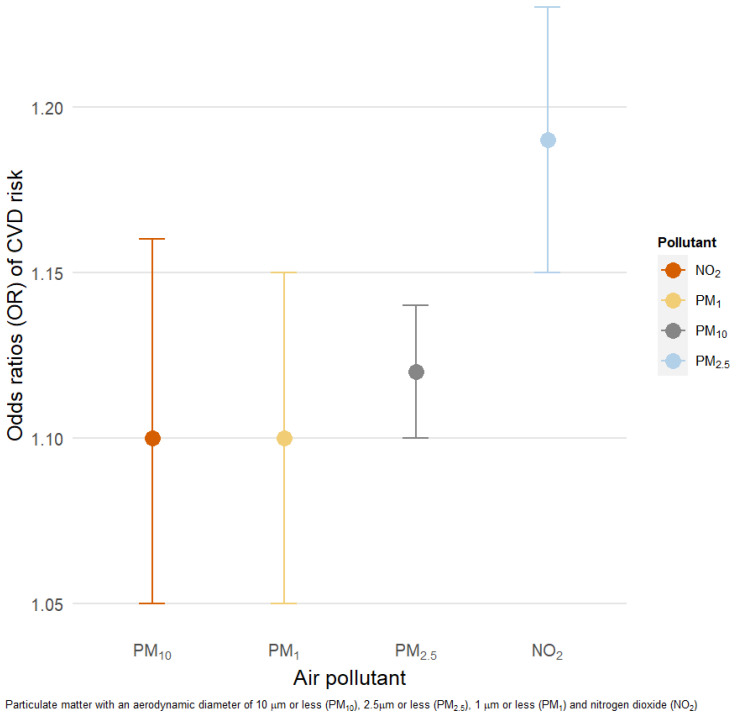
Figure 3.
Association between a 10 μg/m3 increment in 3 year moving averages of air pollution and CVD risk. Models adjusted for age, sex, BMI, tobacco use, physical activity, education level, fruit and vegetable intake, alcohol use, type of fuel used at home, median household income, and location of residence (urban/rural). OR = odds ratio.

