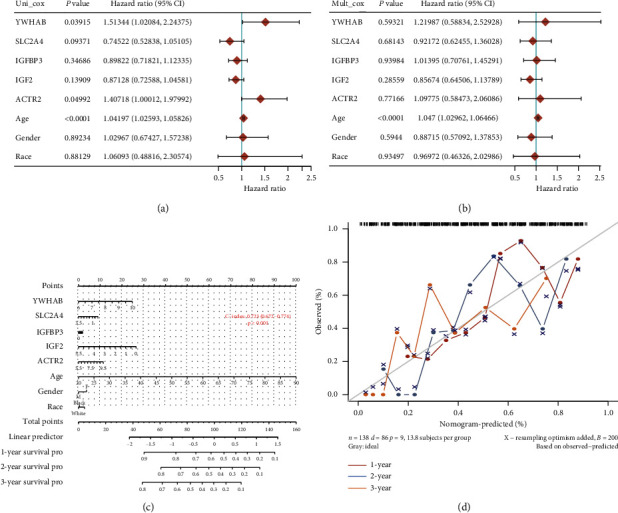
Figure 14.

The results of Cox regression and nomogram analysis in hub genes. (a) Hazard ratio and P value involved in univariate Cox regression and the parameters of the hub genes. (b) Hazard ratio and P value involved in multivariate Cox regression and some parameters of the hub genes. (c) Nomogram to predict the 1-year, 2-year, and 3-year overall survival based on AML patients' characteristics and critical gene expression. (d) Calibration curve for the overall survival nomogram model in the discovery group. A dashed diagonal line shows the ideal nomogram, and the blue line, red line, and orange line represent the 1-year, 2-year, and 3-year observed nomograms.
