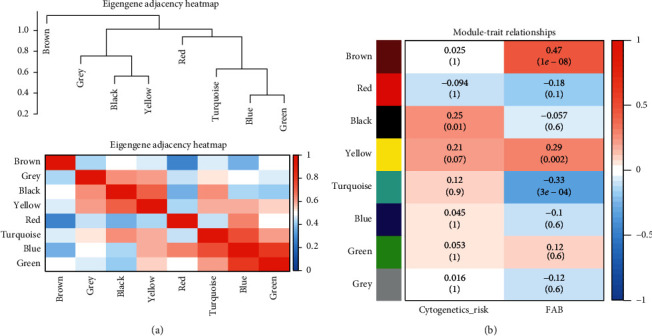
Figure 5.

Heatmap of the clustering relationship of eigengenes adjacencies and module trait. (a) The clustering relationship between different modules. The upper part is the clustering tree between modules, and the lower part is the clustering heatmap between the modules. Red represents the closer the similarity, and blue represents the farther the similarity. (b) The clustering relationship between disease characteristics and modules. Red represents an opposite relationship, and blue represents a negative relationship.
