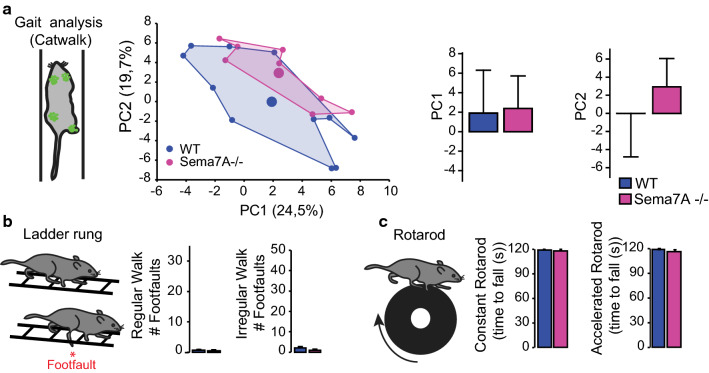
Fig. 2.
Altered serotonergic innervation patterns are functionally compensated in healthy Sema7A deficient mice. a Gait analysis of Sema7A deficient and WT mice using the Catwalk® (scheme on the left). Middle: two-dimensional statistical representation of gait parameters after performing principal component analysis (PCA). The area defined by individual points (blue: WT and pink: Sema7A deficient) is traced to emphasize the gait patterns of each genotype which are largely overlapping (KO: n = 8; WT: n = 11 mice). Right: Bar graphs of average scores on principal components 1 and 2 (PC1 p value = 0.9039; PC2 p value = 0.1774; Mann–Whitney U test). b Quantification of the functional performance of Sema7A deficient (pink lines, n = 15), and WT mice (blue lines; n = 12) in the ladder rung test (scheme left panel, regular walk middle panel; p value = 0.5750; irregular walk, right panel; p value = 0.08326 two-way ANOVA with Bonferroni multiple comparison post-hoc test). c Quantification of the functional performance of Sema7A deficient (pink lines, n = 14), and WT mice (blue lines; n = 14) in the rotarod test (scheme left panel) (constant speed middle panel; p value = 0.5498; accelerated speed, right panel; p value = 0.8402; two-way ANOVA with Bonferroni multiple comparison post-hoc test)

