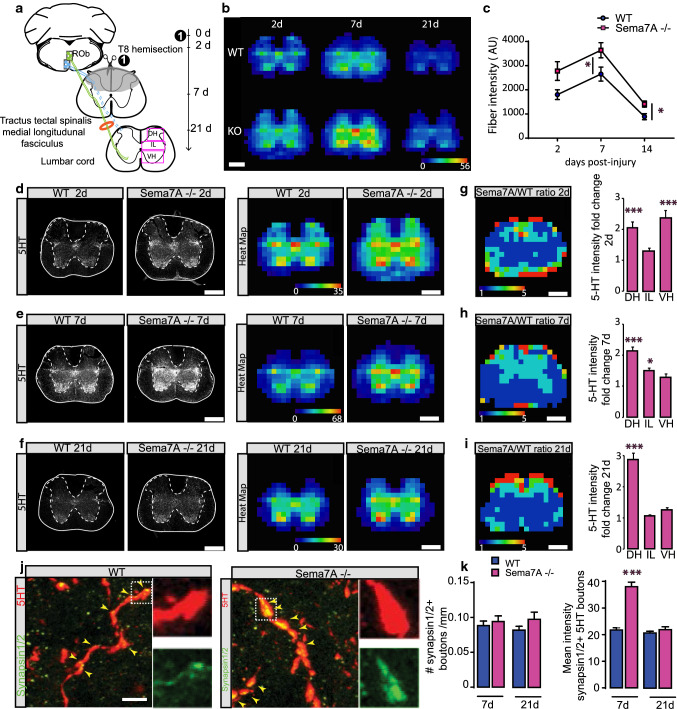
Fig. 3.
Adaptive remodeling of serotonergic connections in response to spinal cord injury is disturbed in Sema7A deficient mice. a Left: scheme of the descending serotonergic axis studied. We focused on descending ventral 5-HT projections from the Tractus tectal spinalis medial longitudinal fasciculus that is not interrupted by the T8 dorsal hemisection in mice. Note that the substantia gelatinosa tract is cut from the lesion. Outlined in the lumbar cord representation are the three areas used for the quantifications obtained in (g, h, i) e.g. dorsal horn (DH), intermediate laminae (IL) and ventral horn (VH). Right: timeline of the experiment following spinal cord injury. b Heatmaps of 5-HT fibers intensity in the lumbar cord at L1 Sema7A deficient and WT mice at different time points following spinal cord injury. Heatmaps go from dark blue (very low fiber intensity) to bright red (very high fiber intensity). c Quantification of relative 5-HT intensity at different time points following spinal cord injury (blue lines: WT mice; pink bars: Sema7A deficient mice; n = 3 for all groups; p values: 2 days = 0.0499; 7 days = 0.0266, 21 days = 0.4431). d–f Confocal images and heatmaps of overall relative 5-HT intensity at 2 days (d), 7 days (e) and 21 days (f) at the lumbar L1 segment of the spinal cord following spinal cord injury. g–i Heatmaps of the fold change ratio of serotonergic projections intensities between Sema7A deficient and WT mice and quantification of relative 5-HT fold change in the dorsal horn (DH), intermediate laminae (IL) and ventral horn (VH) at 2 days (g), 7 days (h) and 21 days (i) (p values: 2 days: DH = 0.0042; IL = 0.9839: VH = 0.002; 7 days: DH ≤ 0.001; IL = 0.0127: VH = 0.091; 21 days: DH ≤ 0.001; IL ≥ 0.9999: VH ≥ 0.9999). Heatmaps go from dark blue (very low fiber intensity) to bright red (very high fiber intensity). j Confocal images of 5-HT boutons doubled-stained with synapsin 1/2 in the spinal cord of WT mice (left) and unlesioned Sema7A deficient mice (right) 7 days following spinal cord injury. Insets are magnified three times. k Quantification of the density of synapsin-positive 5-HT boutons in WT and Sema7A deficient mice (left) and quantification of the mean intensity of synapsin 1/2 positive 5-HT boutons in WT and Sema7A deficient mice (right) at 7 days and 21 days following spinal cord injury. Mann–Whitney test: p value(synapsin bouton density 7 days) = 0.7558; p value(synapsin bouton density 21 days) = 0.1869; p value (mean intensity of synapsin1 positive 5HT boutons 7 days) < 0.0001; p value (mean intensity of synapsin1 positive 5HT boutons 21 days) = 0.2743; n = 103–108 boutons analyzed (left); n = 191–364 boutons analyzed (right). Scale bars in (b, d–i) equal 400 μm. Scale bar in j equals 5 µm. Panels c, g–i: two-way ANOVA with Bonferroni multiple comparison post-hoc test. Panel k: Mann–Whitney tests at 7 and 21 days

