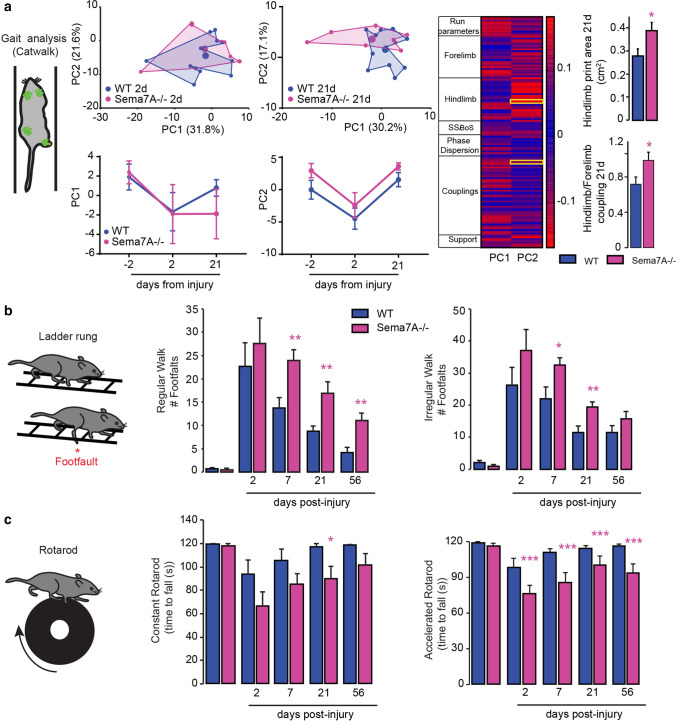
Fig. 5.
Sema7A signalling is required for proper gait and locomotor recovery following spinal cord injury. a Gait analysis of Sema7A deficient and WT mice using the Catwalk® (scheme on the left). Middle left: two-dimensional statistical representation of gait parameters after performing principal component analysis (PCA). The area defined by individual points (blue: WT and pink: Sema7A deficient) is traced to emphasize the specific gait patterns of each genotype at 2 and 21 days post-injury (KO: n = 8, WT: n = 11 mice). Middle right: overtime evolution of principal components 1 and 2 following spinal cord injury. Right panel: color-coded representation of factor loadings that identify each parameter’s correlation coefficient (r) with PC1 and PC2. Parameters with positive/negative correlation are coded in red while those with a correlation close to 0 are coded in blue (see scale). Quantification of hindlimb print area (p value = 0.0259) and print position of Hindlimb/Forelimb (p value = 0.0203, Mann–Whitney U test both) at 21 days extracted from the factor loading. b Quantification of the functional performance of Sema7A deficient (pink lines, n = 15), and WT mice (blue lines; n = 14) in the ladder rung test (scheme left panel, regular walk middle panel; p values: baseline = 0.5750, 2 days = 0.5139, 7 days = 0.0036; 21 days = 0.0057, 56 days = 0.0016; irregular walk, right panel; p values: baseline = 0.0833, 2 days = 0.2171, 7 days = 0.0200; 21 days = 0.0034, 56 days = 0.1702) following spinal cord injury. c Quantification of the functional performance of Sema7A deficient (pink lines, n = 14), and WT mice (blue lines; n = 14) in the rotarod test following spinal cord injury (scheme left panel, constant speed middle panel; p values: baseline = 0.5498, 2 days = 0.13179, 7 days = 0.1362; 21 days = 0.0133, 56 days = 0.0923; accelerated speed, right panel; p values: baseline = 0.8402, 2 days ≤ 0.0001, 7 days ≤ 0.0001; 21 days ≤ 0.0001, 56 days ≤ 0.0001). Data are analyzed with a two-way ANOVA with Bonferroni multiple comparison post-hoc test for the ladder rung and the rotarod

