Fig. 2.
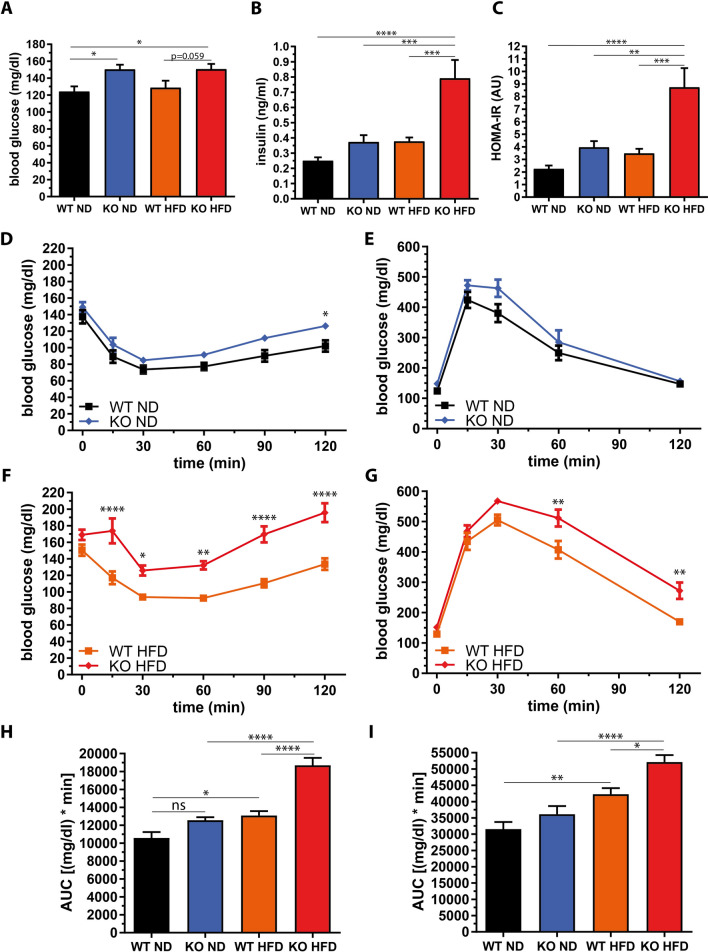
Decreased insulin sensitivity and glucose tolerance in miR-146a−/− mice on a high-fat diet. Blood samples of female miR-146a−/− (KO) and respective control mice (WT) were analyzed after 10 weeks of high-fat diet (HFD) or normal diet (ND) and the animals’ insulin and glucose metabolism were assessed. a Fasted blood glucose, b fasted plasma insulin, and c HOMA-IR. d and e Insulin tolerance test (ITT) and oral glucose tolerance test (OGTT) in mice fed a ND. f and g ITT and OGTT in mice fed an HFD. g Area under the curve (AUC) of ITT. h AUC of OGTT. Data are displayed as mean and SEM of 10 animals per group. Statistics: (a, b, c, h, i) one-way ANOVA with Tukey correction, (d–g) two-way ANOVA with Bonferroni correction, ns not significant, *p < 0.05, **p < 0.01, ***p < 0.001, ****p < 0.0001

