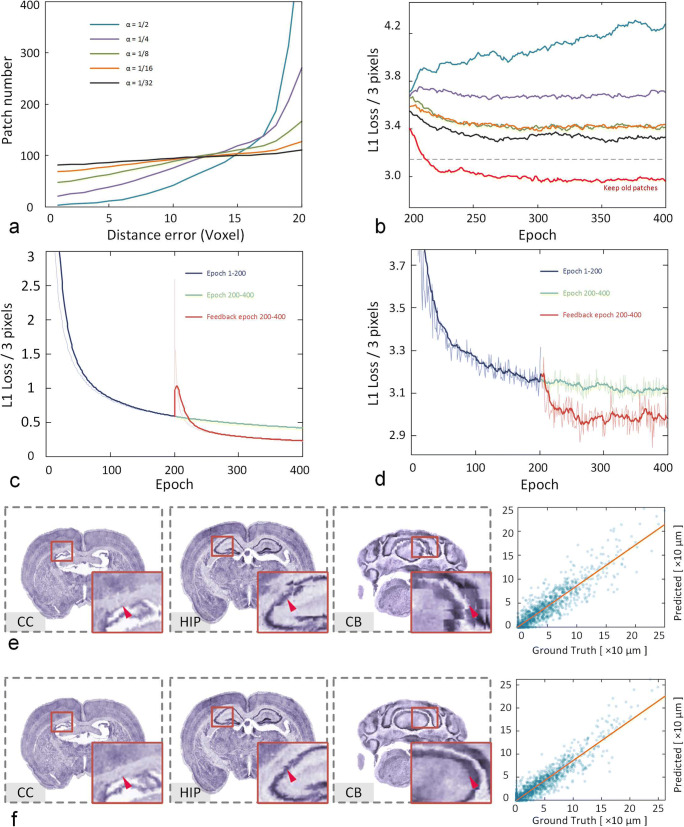
Fig. 3.
The performance of the self-feedback strategy under different parameter settings. a The change in the number of samples for each distance error under different α values. The smaller α is, the more balanced the number becomes. b The loss curves of different α values corresponding to (a). The red line shows the results of retaining the old patches, and the gray dotted line is the loss value of the pretrained model. The loss curves of the training set (c) and validation set (d) with (red line) or without (green line) the self-feedback strategy are shown. The visualized prediction results (left, coronal planes) and correlation plots (right, dot plots) before (e) and after (f) the self-feedback strategy are shown. The registration results are presented by the three coronal planes and the corresponding enlarged views of the local regions in the bottom right corner

