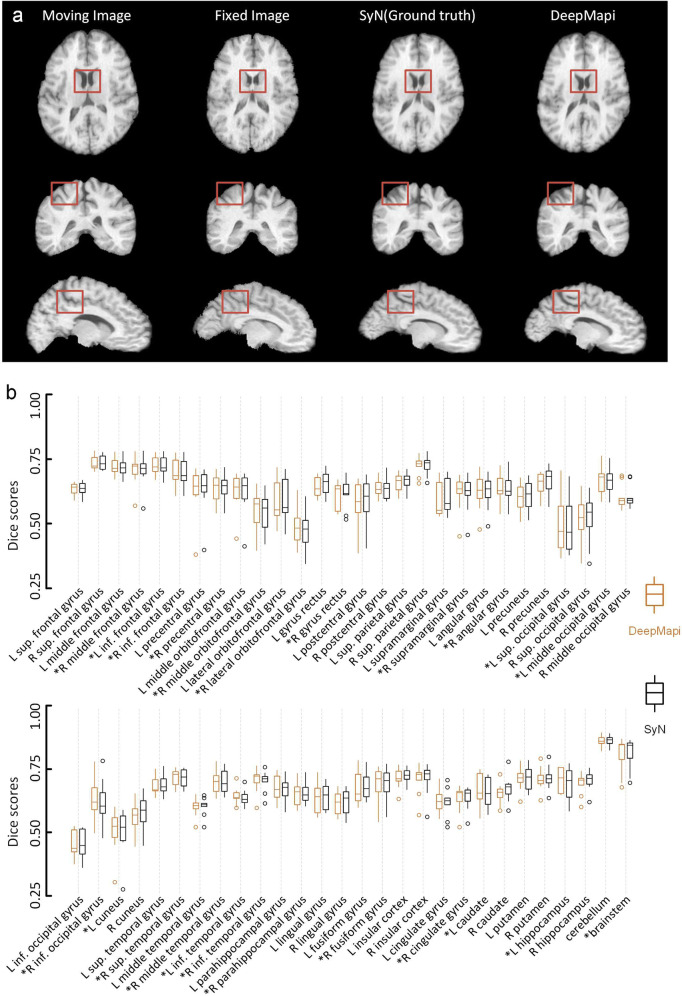
Fig. 8.
The performance and quantitative assessment of SyN and DeepMapi on the LONI LPBA40 datasets. a The registration results of SyN (ground truth) and DeepMapi. Three standard anatomical planes are presented from left to right and the four columns correspond to the moving image, fixed image, SyN registration results and DeepMapi registration results, respectively. The brown boxes represents the same spatial position for the comparisons. b Quantitative assessment of 56 brain regions. The Dice scores of nine brain datasets are presented in a box plot. Brown: DeepMapi. Black: SyN. The regions where DeepMapi achieved a higher median value than SyN are marked with an asterisk (*)

