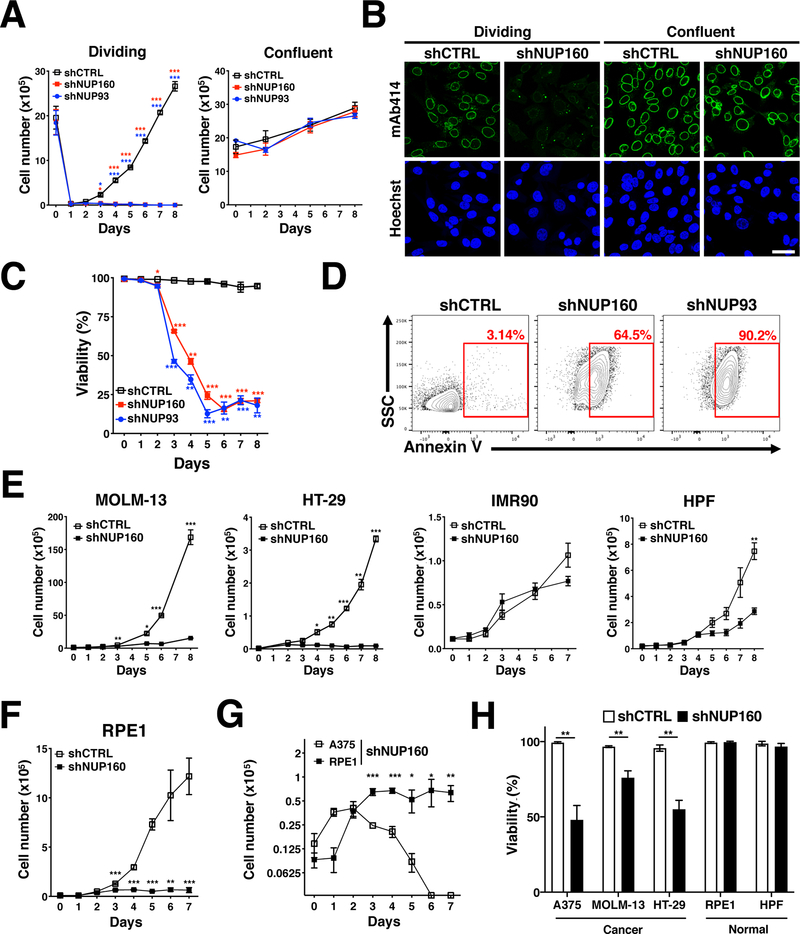
Figure 2. NPC assembly is required for cancer cell survival.
A, A375 cells were treated with doxycycline to induce Control, NUP160, or NUP93 shRNA for 72 hours and at T=0 either replated at 1:10 dilution to induce cell proliferation or maintained in a confluent state, both in the continuous presence of doxycycline. The number of viable cells was counted over time. B, Dividing and confluent A375 cells expressing inducible Control or NUP160 shRNAs were treated with doxycycline to inhibit NPC formation. Dividing and confluent cells were fixed and stained with the NPC antibody mAb414 after 3 or 6 days of knockdown respectively. Images show a representative immunofluorescence of 3 independent experiments. Scale bar 25 μm. C, The viability of A375 proliferating cells expressing Control, NUP160 or NUP93 shRNAs was determined at the indicated time points by automatic counting with the Trypan blue exclusion dye method. stained cells. Graph shows the percentage of cells excluding Trypan Blue (live cells). D, Flow cytometry analysis of Annexin V staining in A375 cells after 6 days of Control, NUP160, or NUP93 shRNA induction. Red rectangles show percentage of Annexin V positive cells. E, MOLM-13, HT-29, IMR90, and HPF cells stably expressing inducible Control or NUP160 shRNAs were treated with doxycycline and the number of viable cells was measured over time. F, RPE1 cells stably expressing inducible Control or NUP160 shRNAs were treated with doxycycline and the number of viable cells was measured over time. G, A375 and RPE1 cells stably expressing inducible Control or NUP160 shRNAs were treated with doxycycline and the number of viable cells was measured over time. H, Viability was determined by automated counting of Trypan blue inclusion/exclusion of A375, RPE1, MOLM-13, HT-29 and HPF cells after 4 days of Control or NUP160 shRNA induction. Data are mean ± s.d. * P ≤ 0.05, ** P ≤ 0.01, *** P ≤ 0.001 by multiple unpaired Student’s t tests with Holm-Sidak method to correct for multiple comparisons in (A, C, E, F, G, H). Experiments are representative of 3 independent repeats.

