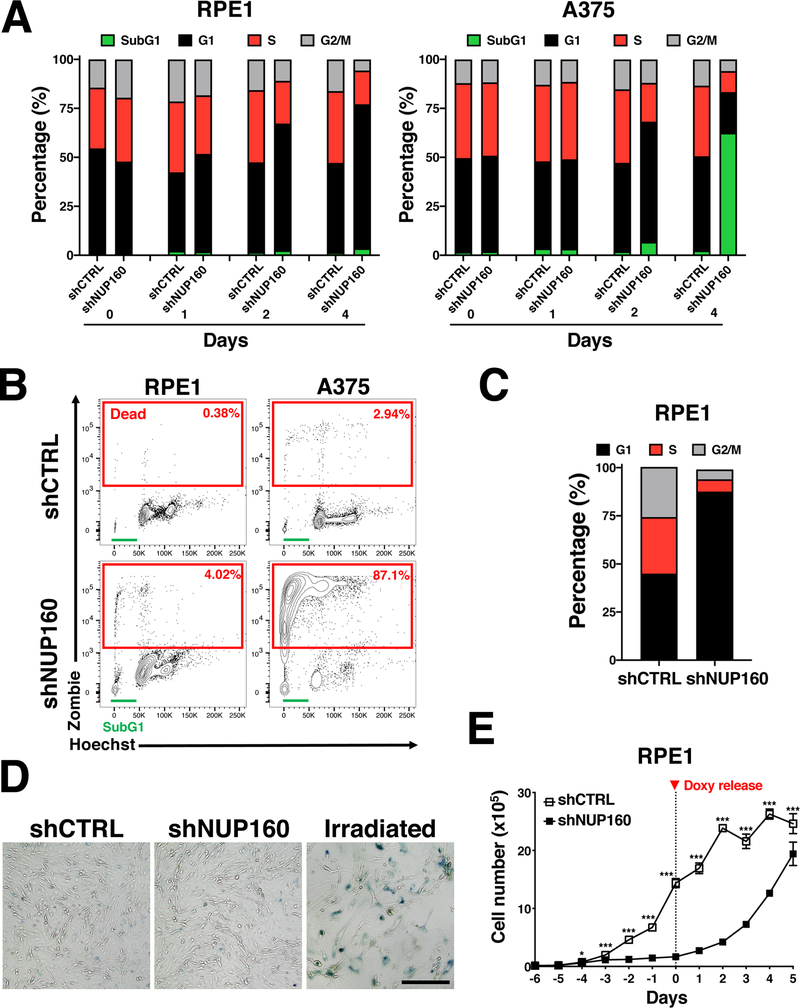
Figure 3. Selective sensitivity of melanoma A375 cells to inhibition of NPC formation.
A, Flow cytometry analysis of cell cycle in RPE1 and A375 cells at the indicated times after induction of Control or NUP160 shRNAs. The percentage of cells in each phase of the cell cycle is indicated. Data are the mean result representative of one of three independent experiments. B, Flow cytometry analysis of viability (Zombie) and cell cycle (Hoechst) in RPE1 and A375 cells at 7 days of Control or NUP160 shRNA treatment. The percentage of non-viable cells, positively stained with the viability dye, is indicated for each condition in red rectangles. The sub-G1 phase of the cell cycle is indicated by a green line. C, Flow cytometry analysis of cell cycle in RPE1 cells at 7 days of Control or NUP160 shRNA treatment. The percentage of live cells in each phase of the cell cycle is indicated. D, β-Galactosidase staining of RPE1 cells after 4 days of Control or NUP160 shRNA induction. RPE1 cells irradiated with 10 Gy and cultured for 7 days were used as positive controls for senescence. Images are representative of 2 independent experiments. E, RPE1 cells expressing inducible or Control or NUP160 shRNAs were treated with doxycycline (doxy) for 6 days. Cell were then incubated with doxycycline-free media (T= 0) to shut down shRNA expression. The number of viable cells before and after doxy release was counted over time by trypan blue exclusion. Data are mean ± s.d. * P ≤ 0.05, *** P ≤ 0.001 by multiple unpaired Student’s t tests with Holm-Sidak method to correct for multiple comparisons in (E). Unless noted, experiments are representative of a minimum of 3 independent repeats.

