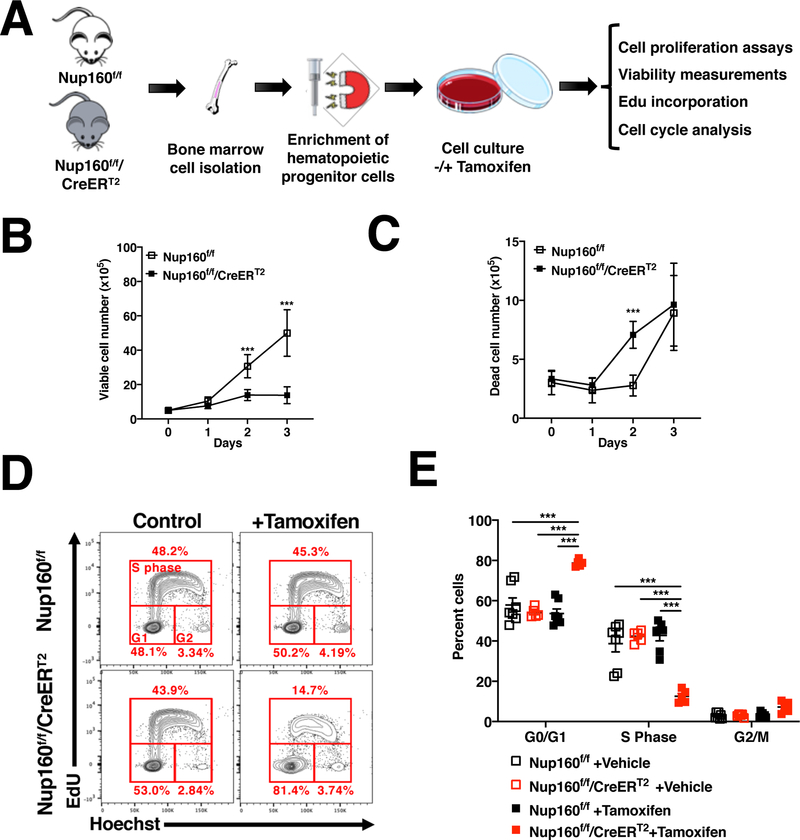
Figure 4. Primary hematopoietic cells arrest in response to inhibition of NPC assembly.
A, Schematic illustration of experimental approach to evaluate the effect of Nup160 knockout in mouse primary hematopoietic cells. B, C, Hematopoietic progenitors isolated from control (Nup160f/f) or Nup160 inducible knockout mice (Nup160f/f/CreERT2) were treated with DMSO vehicle or 4-hydroxytamoxifen to knockout Nup160 and the number of viable (B) and dead (C) cells was quantified over time by trypan blue exclusion. D, Flow cytometry analysis of cell cycle and EdU incorporation in Nup160f/f and Nup160f/f/CreERT2 hematopoietic progenitor cells after 72 hours of tamoxifen treatment followed by incubation with EdU for 2 hours. E, Quantification of EdU incorporation and cell cycle stages from (D). Each data point represents cells isolated from an individual animal (n = 5–7). Data are mean ± s.e.m. * P ≤ 0.05, *** P ≤ 0.001 by multiple unpaired Student’s t tests with Holm-Sidak method to correct for multiple comparisons in (B, C) or by two-way analysis of variance (ANOVA, E). Graphs are representative of 3 independent experiments

