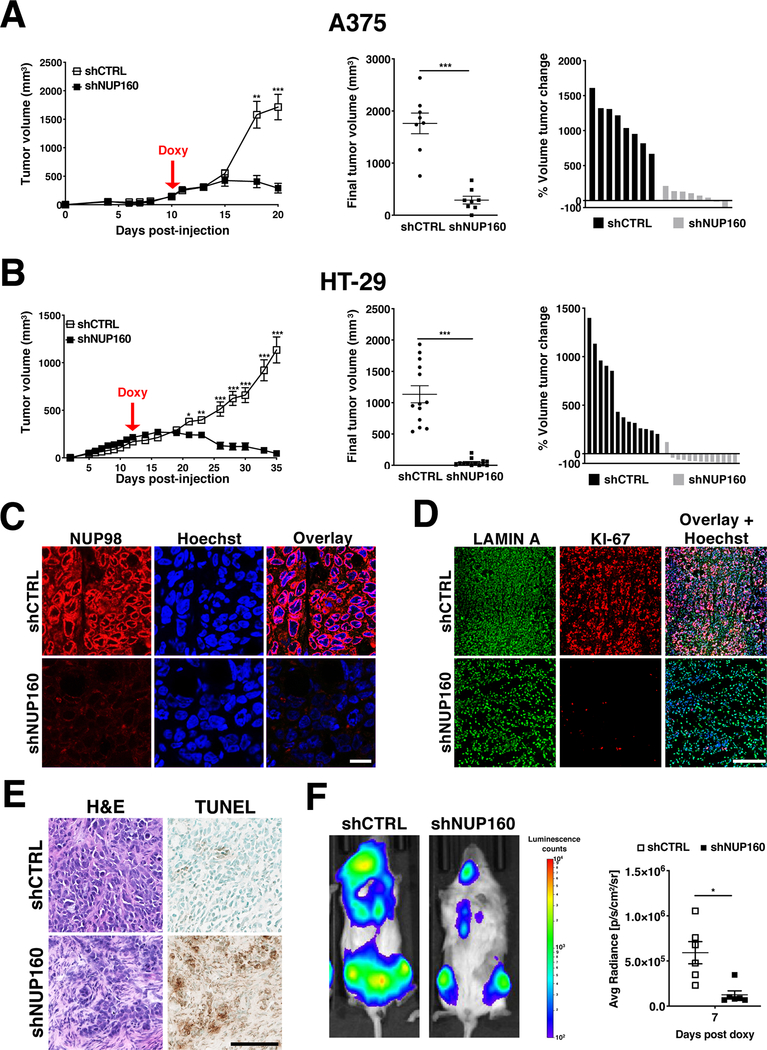
Figure 7. Inhibition of NPC assembly prevents tumor growth and causes tumor regression.
A, B, Tumor volume analyses in A375 and HT-29 xenografts (n = 8 or 13) before and after induction of Control and NUP160 shRNAs with doxycycline (left) and at the final time point (center). Each symbol represents an individual tumor. Percent change of final tumor volume to the start of doxycycline treatment (right). C, Representative images of NUP98 staining in sections from Control or NUP160 shRNA HT-29 tumors from (B) at the final experimental time point (Day 35). Scale bar, 25 μm D, Representative images of LAMIN A and KI-67 staining in sections from Control or NUP160 shRNA HT-29 tumors from (B) at the final time point (Day 35). Scale bar, 250 μm. E, Representative images of Hematoxylin & Eosin (H&E) and Terminal deoxynucleotidyl transferase dUTP nick end labeling (TUNEL) staining of sections from HT-29 Control or NUP160 shRNA tumors from (B) at the final time point (Day 35). Scale bar 100 μm. F, Representative bioluminescence images (left) and quantification (right) of injected with MOLM-13-luciferase cells expressing Control or NUP160 shRNAs (n = 6 mice). Data are mean ± s.e.m. * P ≤ 0.05, ** P ≤ 0.01, *** P ≤ 0.001 by unpaired Student’s t test (A, B middle, F) or multiple unpaired Student’s t tests with Holm-Sidak method to correct for multiple comparisons (A, B left). Images (C, D, E) are representative of 2 independent experiments.

