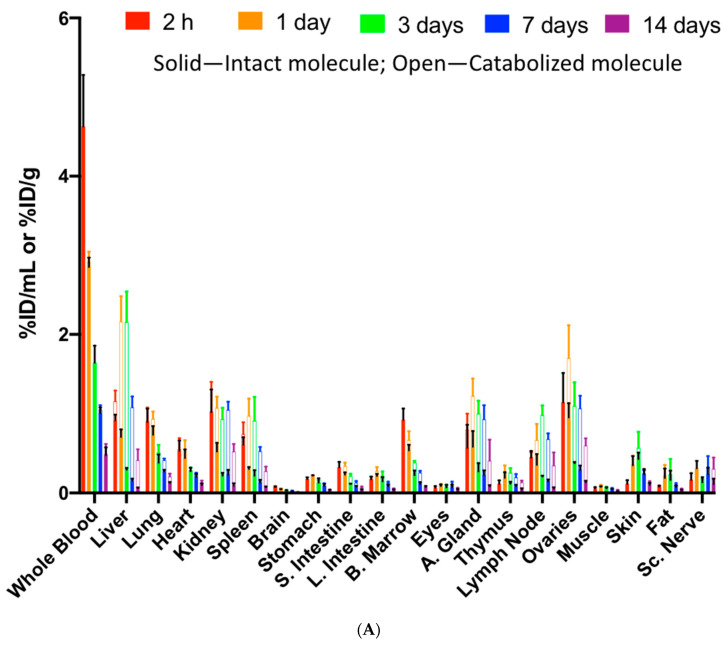
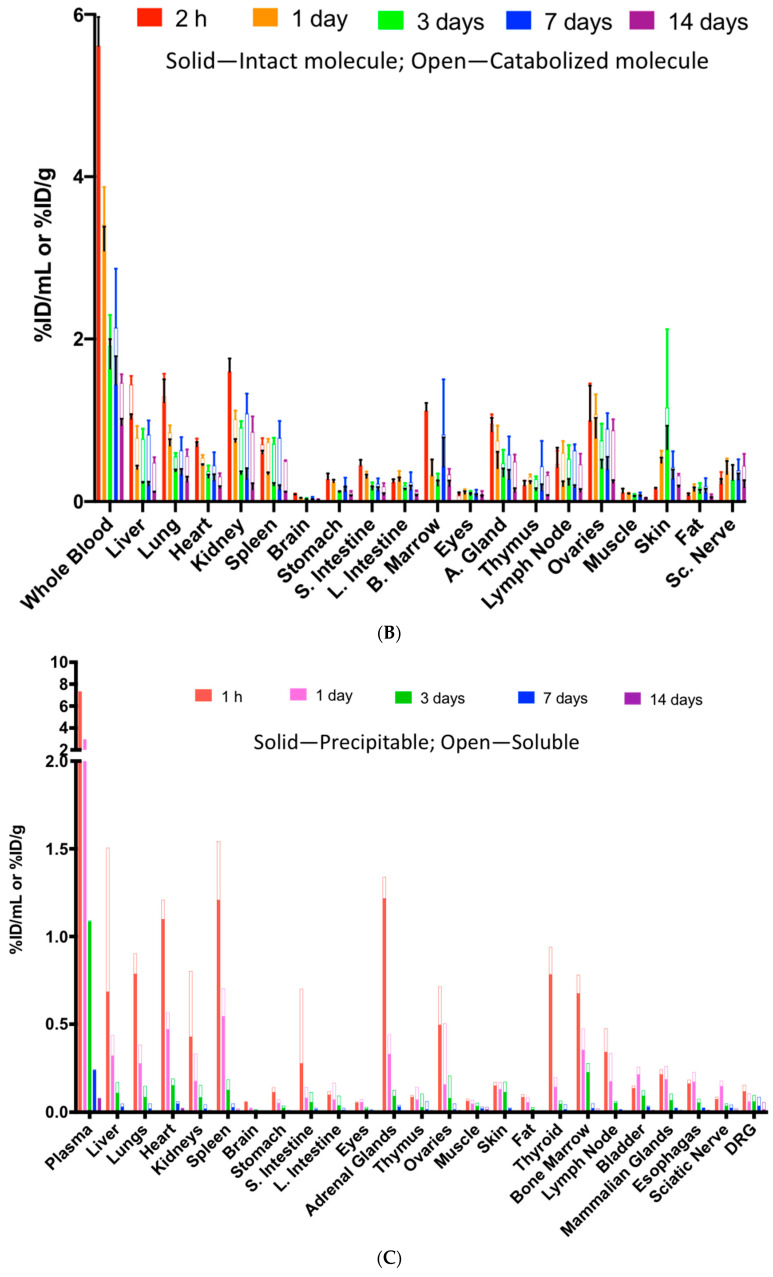
Figure 6.
The tissue distribution of radiolabeled polatuzumab vedotin and unconjugated polatuzumab antibody after a single dose via IV administration in rats. (A) The tissue and blood radioactivity from intact (125I radioactivity—solid bar) and catabolized (subtract 125I radioactivity from 111In radioactivity—open bar) polatuzumab vedotin dosed at the tracer (≈3 μg/kg) level up to 14 days post administration. (B) The tissues and blood radioactivity from intact (125I radioactivity—solid bar) and catabolized (111In subtracted with 125I radioactivity—open bar) unconjugated polatuzumab antibody dosed at the tracer (≈3–4 μg/kg) level up to 14 days post administration. (C) The tissues and plasma radioactivity from conjugated (3H precipitated radioactivity—solid bar) and deconjugated (3H soluble radioactivity—open bar) [3H]-MMAE-polatuzumab vedotin dosed at 10 mg/kg up to 14 days post administration. A higher distribution of polatuzumab vedotin was observed in highly perfused tissues, such as the liver, spleen, and kidneys, and resulted in higher catabolism. The data are represented as the mean ± SD (except in (C) where only the mean is reported). n = 3 per time point. S. Intestine: small intestine; L. Intestine: large intestine; B. Marrows: bone marrows; A. gland: adrenal glands; DRG: dorsal root ganglions; Sc. Nerve: sciatic nerve.


