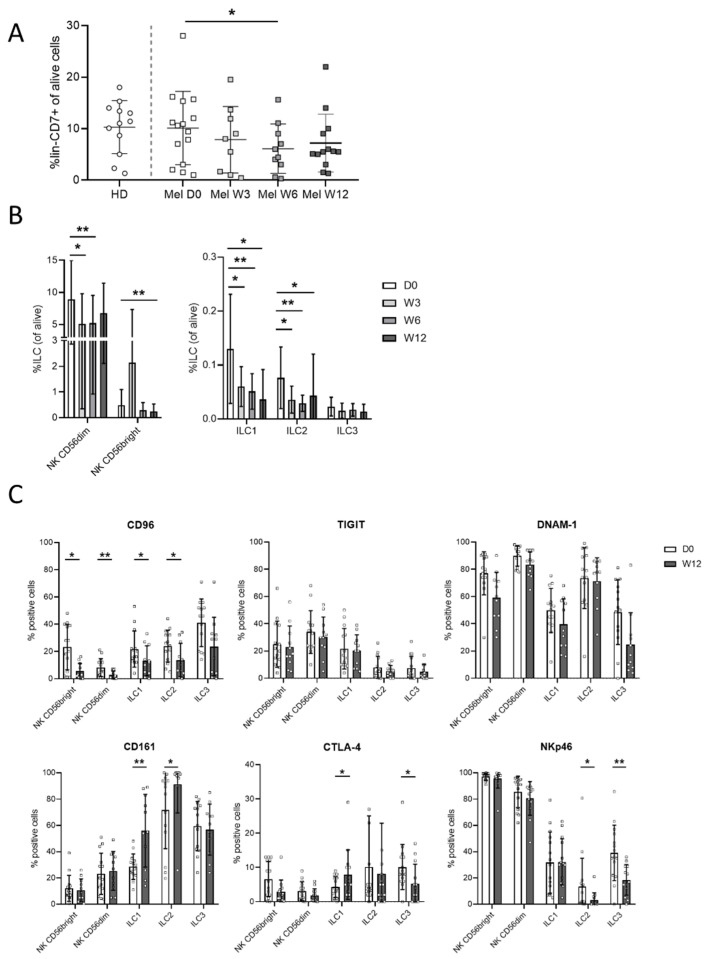
Figure 3.
Phenotypic assessment of the immune checkpoint in ILCs from patients treated with ipilimumab. Percentages of lin−CD7+ ILCs in live PBMCs from donors and patients following ipilimumab treatment at day 0, weeks 3, 6 and 12 (D0, W3, W6, W12) (A). Percentages of the different ILC populations in lin−CD7+ cells in patients following treatment (B). Expression of receptors in ILC populations in patients at D0 and at W12 of treatment (C). A Wilcoxon matched-pair signed rank test was used to compare percentages between D0 and other times of treatment (* p < 0.05, ** p < 0.01).

