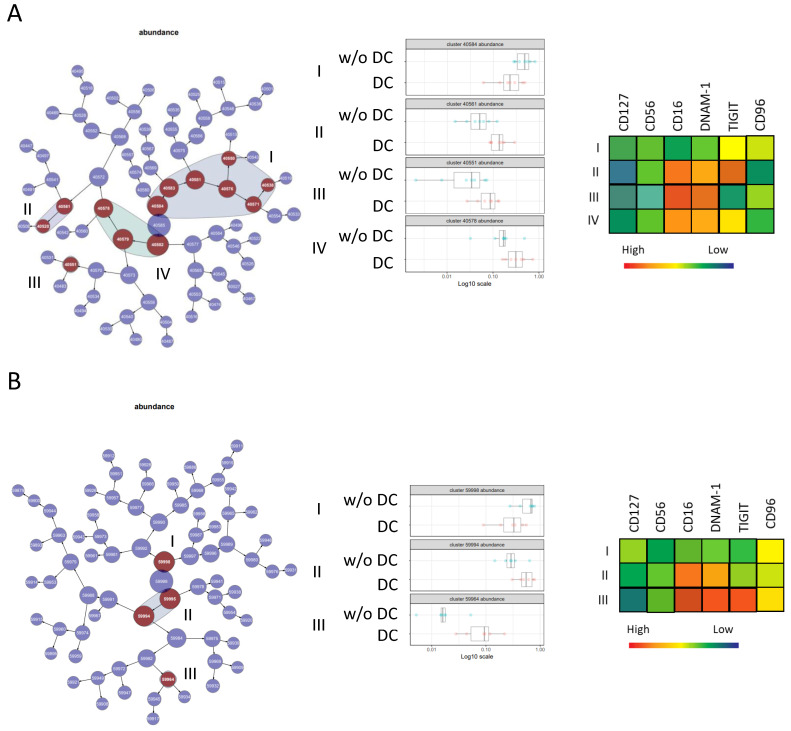
Figure 5.
Comparison of natural killer (NK) subpopulations in DC patients and in patients w/oDC with citrus. A hierarchical clustering map of the CITRUS analysis comparing DC patients and w/oDC patients at D0 (A) and W12 (B). Clusters whose cell abundances are different between the two conditions are in dark red. Four groups of clusters are noted at D0 and three at W12. The cell abundance in the different clusters is represented on the left side with a heatmap presenting the phenotypes of these clusters.

