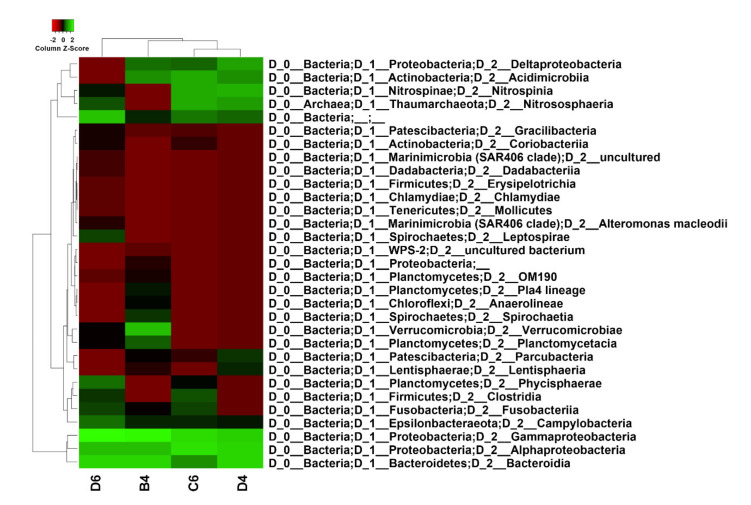
Figure 1.
Heatmap of taxon relative abundance using taxonomic profiling, showing that sponge samples were all dominated by Gammaproteobacteria, Alphaproteobacteria and Bacteroidia. Sample code: B4 = M. (Oxymycale) acerata; D4 = H. pilosus, D6 = M. sarai, C6 = H. (Rhizoniera) dancoi. Scaling was done by column and clustering was performed using average linkage method and Manhattan distance measurement. Values were normalized as Log10.

