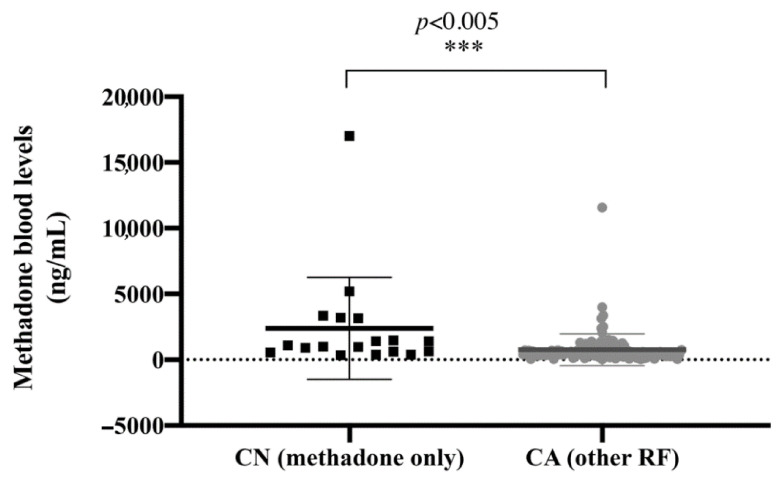
Figure 3.
Comparison in blood methadone concentrations between controls (CN, i.e., cases in which methadone was the only cause of death, in black) and cases (CA, i.e., cases in which methadone was associated with other clinical-circumstantial (naive/non-tolerant state) or toxicological (other drugs detected in blood) conditions or with pulmonary or cardiovascular diseases, in red). Single values, as well as mean (thicker central line) and standard deviation (thinner lines) are shown. Two data outside the axis limit are not shown. *** = statistically significant result.

