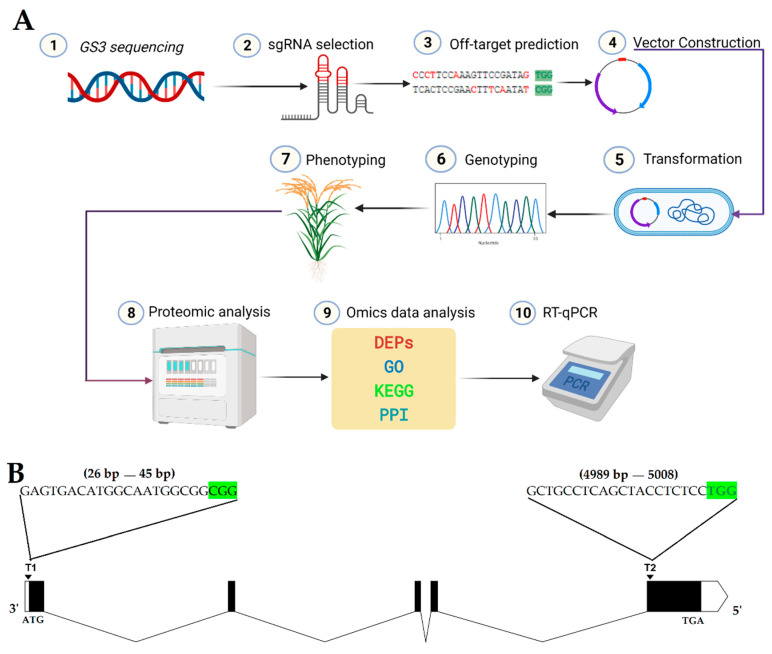
Figure 8.
(A) Schematic diagram of the procedure for CRISPR/Cas9-based generation of mutant plants and analysis of mutations. Two sgRNAs were selected using the CRISPR-GE online web-based tool, and vector was constructed. Agrobacterium-mediated transformation was performed, and T0 plants were regenerated. Later generations were produced by self-pollination, and genotyping was performed using target-specific primers. The phenotypic data of mutant and wild-type (WT) plants were recorded and further analyzed. The proteomic analysis was also performed, and RT-qPCR was performed to assess the GS3 expression level and validate the proteomic data. (B) Diagram of GS3 gene and positions of both target sites. ATG is the start codon; TGA is the stop codon; green highlighted CGG and TGG are the PAM sequences; the white boxes at extreme left and right represent the untranslated (UTR) regions, the black boxes represents the exons; black lines in between the exon regions represent the intron regions, T1 and T2 represent target 1 and target 2, respectively.

