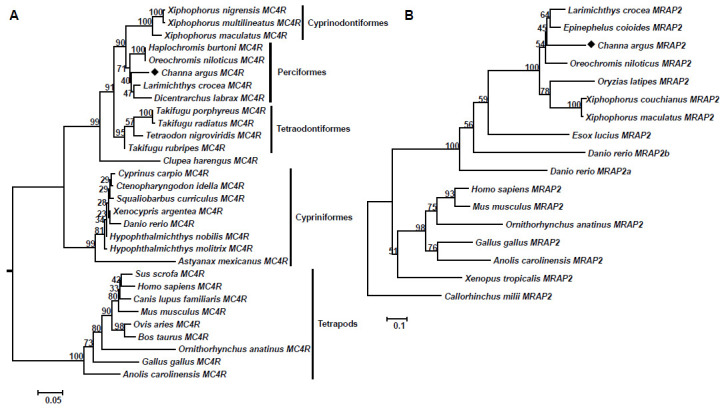
Figure 3.

Phylogenetic trees of vertebrate MC4R (A) and MRAP2 (B). Both trees were constructed with MEGA 6.0 software based on protein datasets. The values at the nodes represented bootstrap percentages from 1000 replicates. The caMC4R and caMRAP2 were marked with a black diamond. The IDs of protein sequences used in present study were shown in Tables S2 and S3.
