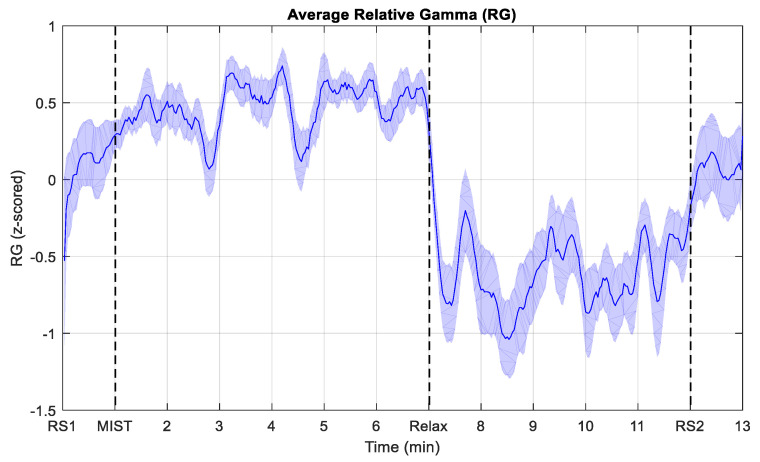
Figure 4.
Evolution of the average relative gamma (RG) during the experiment. To obtain the average, the RG from the participants whose response was inversely proportional to the stress level felt was inverted before averaging. RS1 and RS2 indicate the start of the resting state periods. MIST corresponds to the beginning of the stress session (only the six-minute test phase). Relax refers to the start of the relaxation phase. The shaded area corresponds to the standard error of the mean (SEM).

