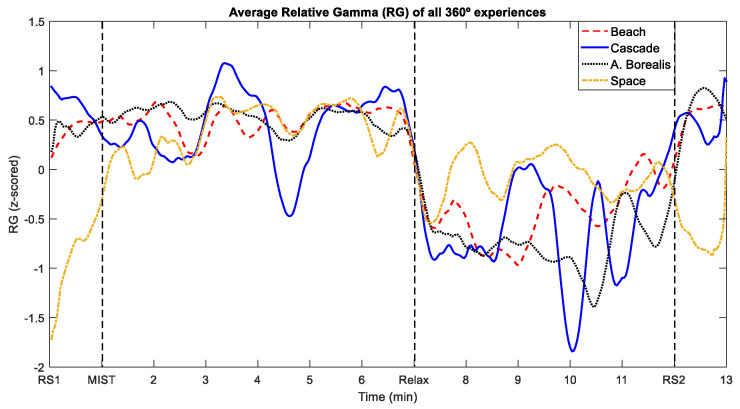
Figure 7.
Comparison of the time evolution of the average RG for the four different 360-degree experiences. The dashed line corresponds to the Beach experience. The solid line represents the Cascade cave experience. The dotted line corresponds to the Aurora Borealis experience. The dash-dotted line represents the Space experience.

