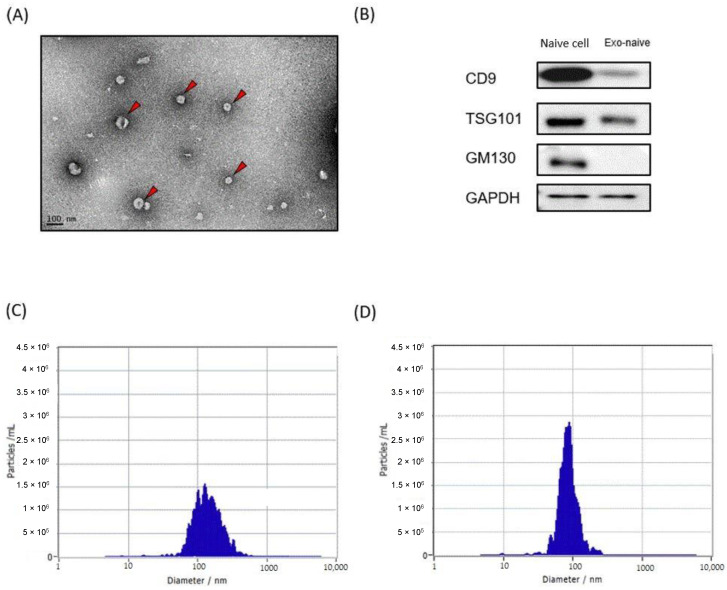
Figure 1.
Exosome and liposome characterization. (A) Transmission electron microscopy of HEK293T-derived exosomes. (B) Western blot analysis of HEK293T cells and their exosomes for the indicated proteins. (C,D) Representative graphs of nanoparticle tracking analysis demonstrating size distribution and concentration of exosomes (C) and liposomes (D).

