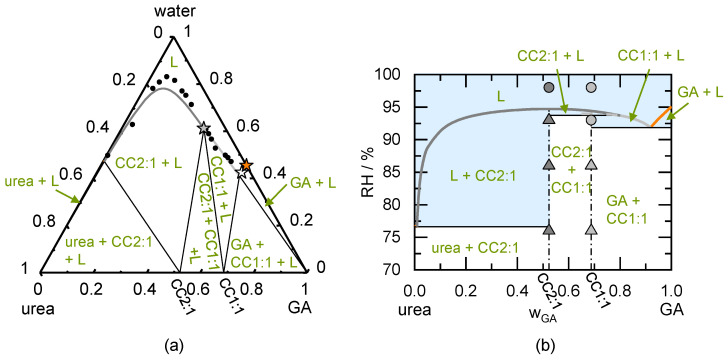
Figure 4.
(a) Modeled ternary phase diagram of urea/glutaric acid in mass fractions at 298.15 K. The urea solubility line starting from the left axis, the CC2:1 solubility line in the middle intersecting into the CC1:1 solubility line. The GA solubility line starts from the right axis (not to be seen). The thin solid lines indicate the phase boundaries. The circles indicated solubility measurements obtained from the literature [27]. The stars indicate measurements used to fit the binary interaction parameters and solubility products of the CCs; (b) Predicted phase diagram of urea/glutaric acid showing the thermodynamically stable phases as function of the mass fraction in the dry system and RH at 298.15 K. The thick solid urea deliquescence line starting from the left axis immediately intersecting the thick solid CC2:1 deliquescence line in the middle, which is intersecting into the CC1:1 deliquescence line. The thick solid deliquescence line of GA starts from the right axis. The thin solid lines indicate the phase boundaries, the thin dash-dotted lines indicate the CC stoichiometries. Dark grey symbols indicate results of CC2:1 stability measurements after 49 days of storage and light grey symbols indicate results of CC1:1 stability measurements after 49 days of storage. Triangles represent unchanged CC samples. Circles indicates deliquescence during storage.

