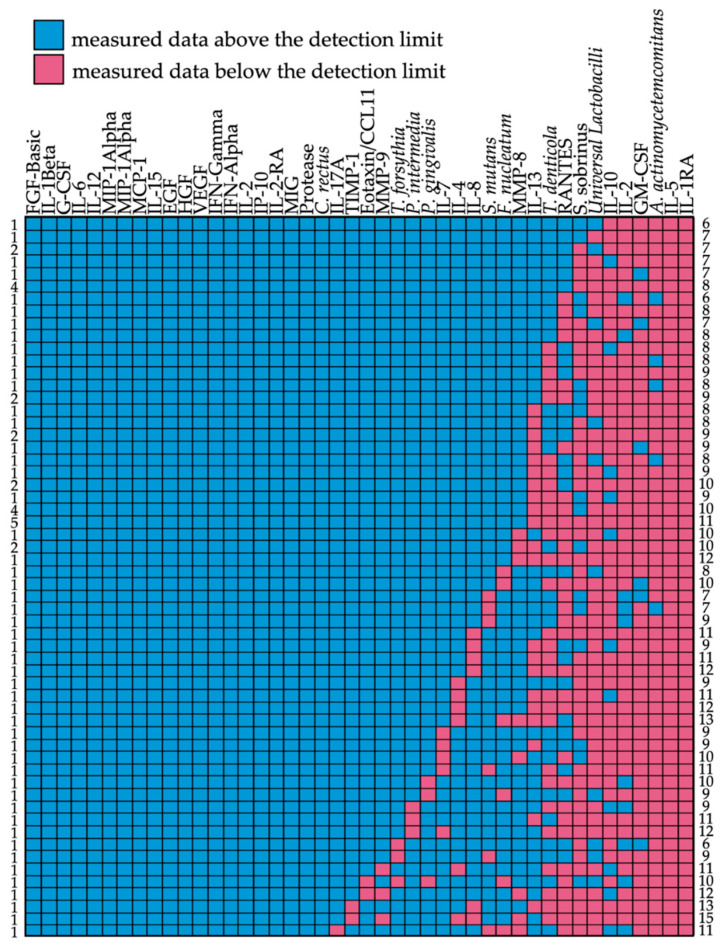
Figure 2.
Detection matrix of all biomarkers (x-axis) in the analyzed 73 subjects (y-axis). Color codes show data measured above (blue) or below (red) the detection limit. Numbers on the left correspond to the numbers of patients with the same pattern of biomarkers above/below the detection limit. Numbers on the right represent the numbers of biomarkers below the detection limit per line.

