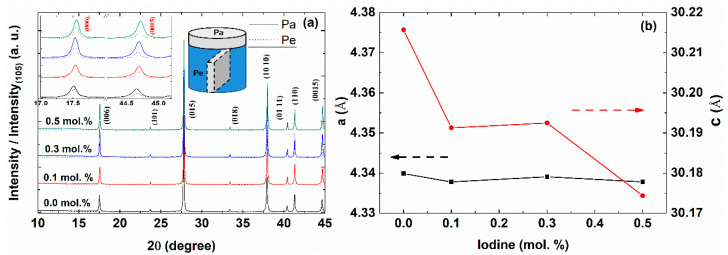
Figure 1.
X-ray diffraction (XRD) peaks for the parallel (Pa, solid line) and perpendicular (Pe, dotted line) directions to the press direction (a) and the lattice parameters of the a-axis (black square, left axis) and c-axis (red circle, right axis) (b) of the Bi2Te2.85Se0.15Ix (x = 0.0, 0.1, 0.3, and 0.5 mol.%) compounds. The right upper inset shows the intensity ratio of the (00l) peaks.

