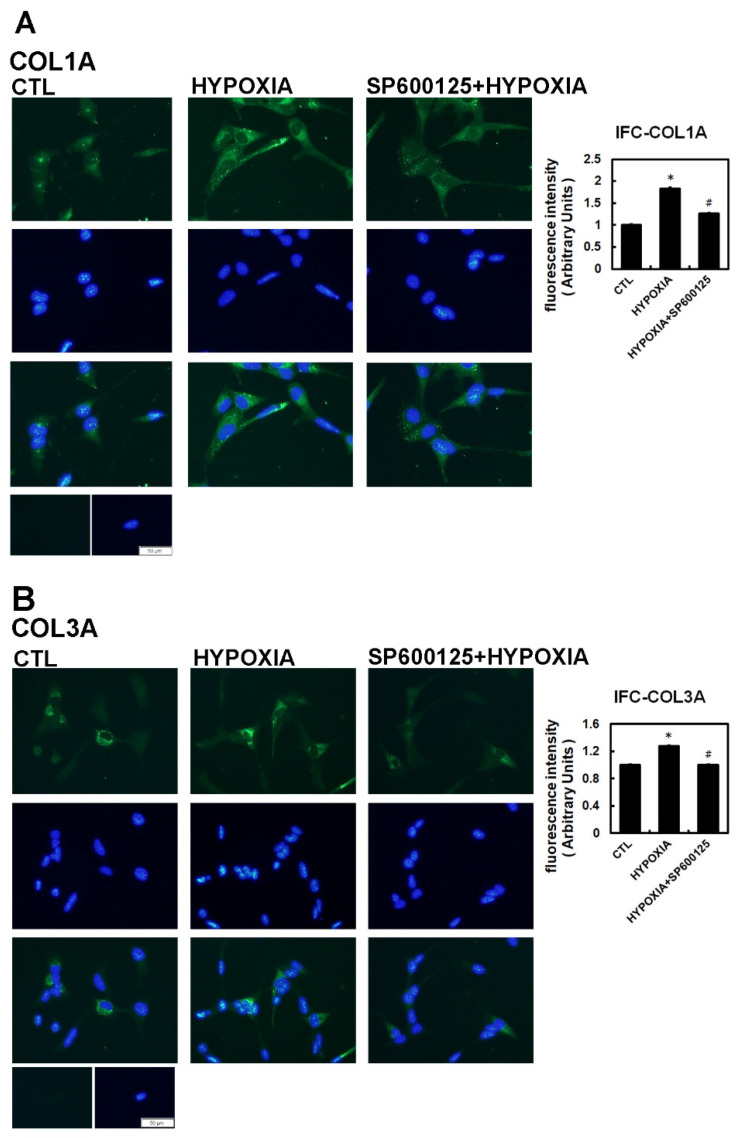
Figure 4.
Immunohistochemistry assay of hypoxia-treated HL-1 cells. The HL-1 cells were pre-treated with inhibitors SP600125 (10−5 M) or DMSO as a vehicle for 30 min, treated with hypoxia stress (1% O2) for 6 h, fixed and subjected to immunostaining with anti-COL1A (Panel A) and anti-COL3A antibody (Panel B). Quantification of the number of pixels with intracellular label was determined digitally from the fluorescence microscopic images. All indicated fibrotic marker protein densities were significantly reduced in all the cells pre-treated with SP600125 compared to those treated by hypoxia only. Values are the arithmetic means of at least three independent experiments and change to the numbers of pixels are expressed as percent increase or decrease compared to the control level (DMSO only). The percentage of fluorescing cells was calculated per condition as described in Methods. The scale bar corresponds to 50 µM. The data are mean ± SEM (n > 100, * p < 0.01 vs. control; # p < 0.05 vs. hypoxia).

