Figure 6.
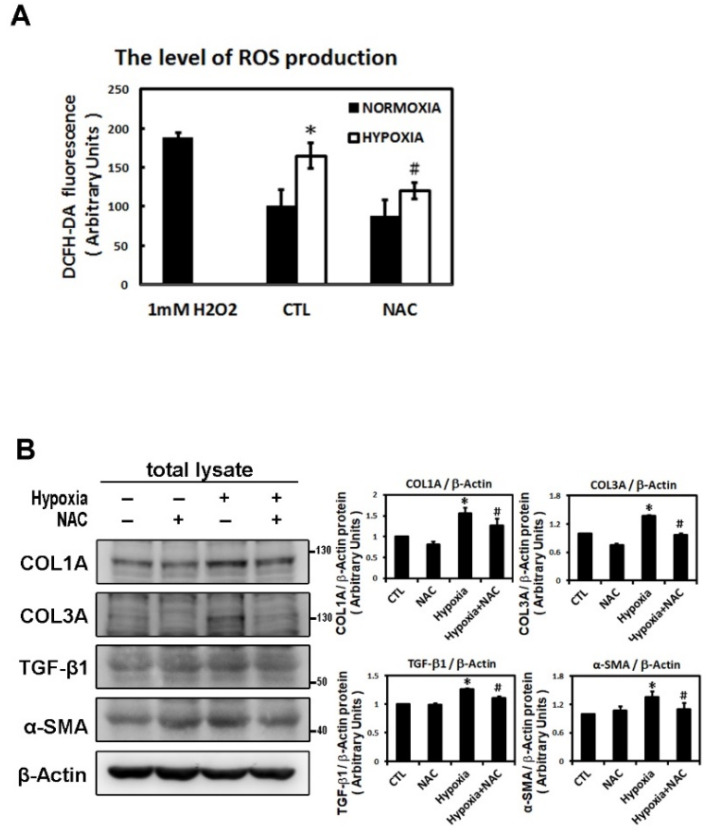
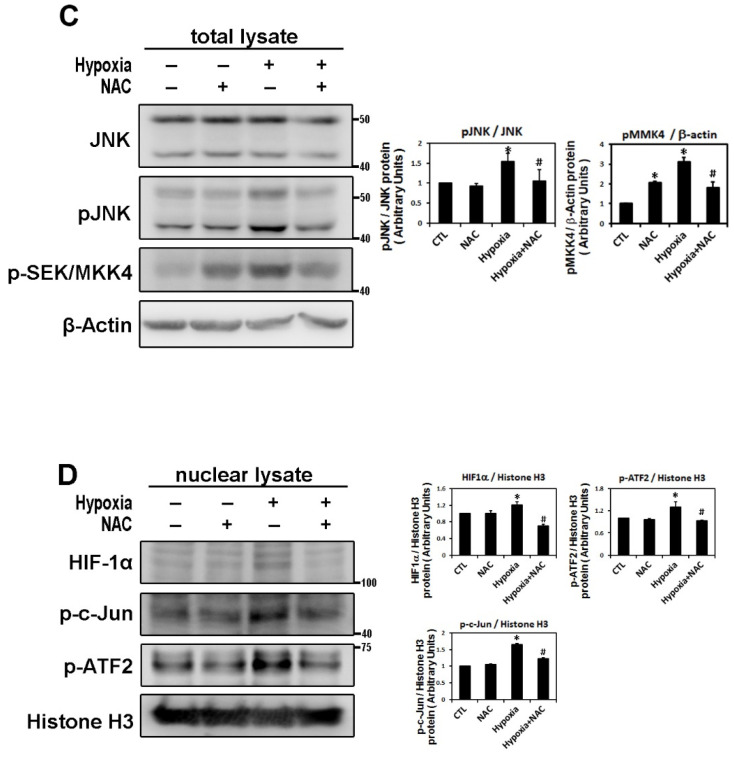
Reactive oxygen species (ROS) module hypoxia-induced HIF-1α, JNK signal pathway and fibrosis-related proteins expression in HL-1 cells. Panel A: The ROS levels were assessed with dichlorofluorescin diacetate (DCFH-DA) in HL-1 cells that were pre-incubated with NAC (2 mM) or vehicle only (CTL) for 2 h, then subjected to normoxia (5% CO2 and 95% air) or hypoxia (1% O2) stimulation for 6 h. The bar graph shows the value of each sample relative to that of control cells under normoxic (vehicle only) or hypoxic conditions. The data are mean ± SEM (n = 4 per group, * p < 0.05 vs. control; # p < 0.05 vs. hypoxia) from four independent experiments. Panel B and C: Representative Western blots and levels of fibrosis-related proteins (COL1A, COL3A, TGF-β1, α-SMA), JNK, phosphorylated JNK and MKK4 for whole cell lysate in HL-1 cells pre-treated with or without NAC (2 mM) for 2 h, then treated under hypoxic (1% O2) or normoxic conditions for 6 h. The data are mean ± SEM (* p < 0.05 vs. control; # p < 0.05 vs. hypoxia) from at least three independent experiments. Panel D: Representative Western blots and levels of HIF-1α, fibrosis-related proteins (COL1A, COL3A, TGF-β1, α-SMA) in nuclear lysates of HL-1 cells pre-treated with or without NAC (2 mM) for 2 h, then treated under hypoxic stress (1% O2) or normoxic conditions for 6 h. The bar graph shows the value of each sample relative to that of control cells under normoxic (vehicle only) or hypoxic conditions. The data are mean ± SEM (* p < 0.05 vs. control; # p < 0.05 vs. hypoxia) from at least three independent experiments.


