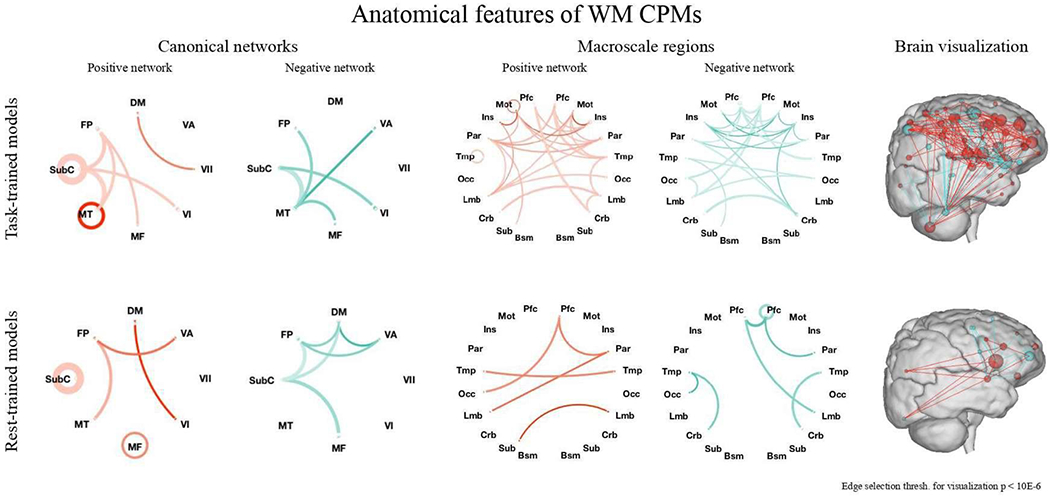
Figure 2. Functional anatomy of positive and negative networks of WM task-trained (top) and rest-trained (bottom) WM CPMs.

Left and center: In both positive (red) and negative (blue) networks of task- and rest-trained models, a broad range of connections was utilized. Line saturation indicates the proportion of edges of the particular network pair involved in prediction, with darker lines indicating a higher proportion of edges utilized. Line width indicates the total number of edges possible in the pair, with thicker lines indicating more possible edges. Canonical networks include default mode (DM), subcortical-cerebellum (SubC), frontoparietal (FP), motor (MT), medial frontal (MF), visual association (VA), VI, and VII. Edge selection threshold for visualization is P < 1*10−6 for clarity. Right: Positive (red) and negative (blue) edges of the task-trained (left) and rest-trained (right) models of WM described in the manuscript. Spheres represent nodes and lines represent functional connections between them. Nodes are sized according to the total number of connections they have in both the positive and negative networks and are colored according to the network in which they have more connections. The right surface representation images were created using the publicly available BioImage Suite Connectivity Viewer Tool.
