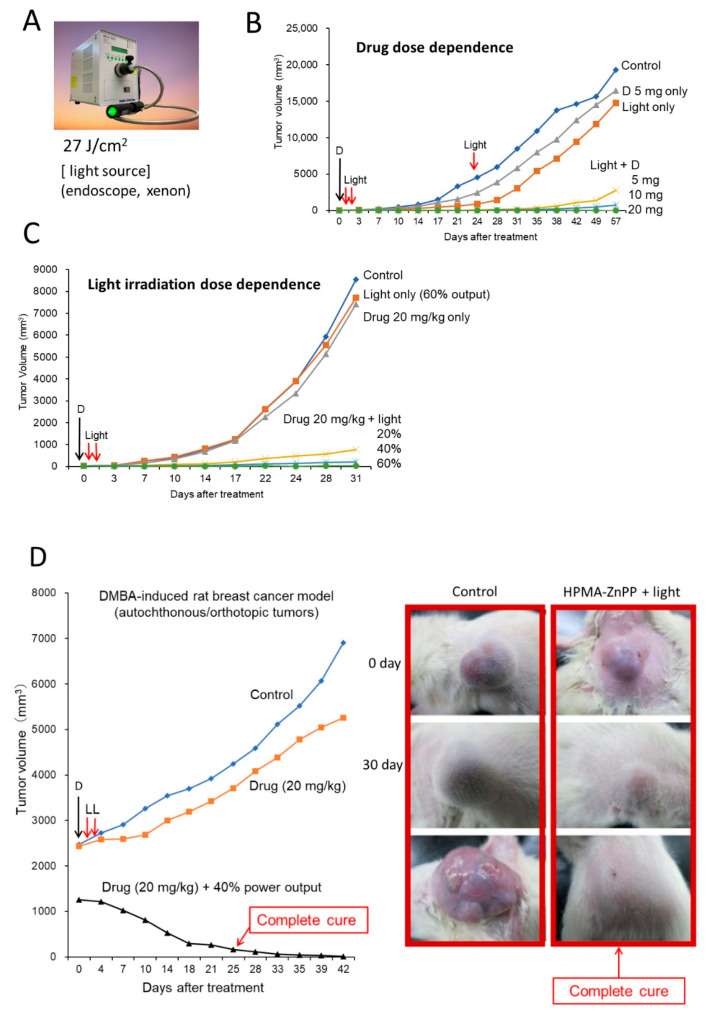
Figure 5.
Photodynamic therapy (PDT) with polymeric PSs. (A) View of the light source for the endoscope; a xenon lamp was used. (B) Dose dependence of P-ZnPP dosage, marked D. (C) Dose of light irradiation intensity. The D indicates the time of drug injection of P-ZnPP in B and C. The power of irradiation light (%) is relative to full power output of the endoscope (100%). (D) Results of PDT treatment of DMBA-induced breast cancer in rats. L, light irradiation. D, drug injection. Control received only light. Boxed images at right show growth and suppression of tumor after PDT and P-ZnPP treatment (right) and tumor without treatment (left).

