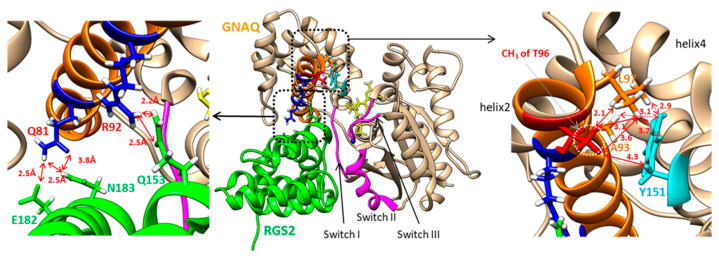
Figure 5.
The complex structure (PDB ID: 4EKD) of GNAQ (tan) and RGS2 (green). The regions of Switches I–III are depicted in pink. Helix 2 of GNAQ is colored in orange. The dotted rectangles in the center are enlarged in the left or right panels. The left panel shows the hydrogen bonding network between the helical domain of GNAQ and RGS2. The identification of hydrogen bonding was calculated using the software University of California, San Francisco (UCSF) Chimera. The right panel shows the hydrophobic network between helix 2 and helix 4 of GNAQ. The side chain of T96 is depicted in red. The side-chain atoms of Tyr151 are shown in cyan. The solid-line arrows represent the distances between the methyl protons of T96 and the other atoms. The dotted line arrows show the distance between the side chain of Tyr151 and the side chain of Ala93 and Leu97. The distance unit, Å, is removed for clear presentation.

